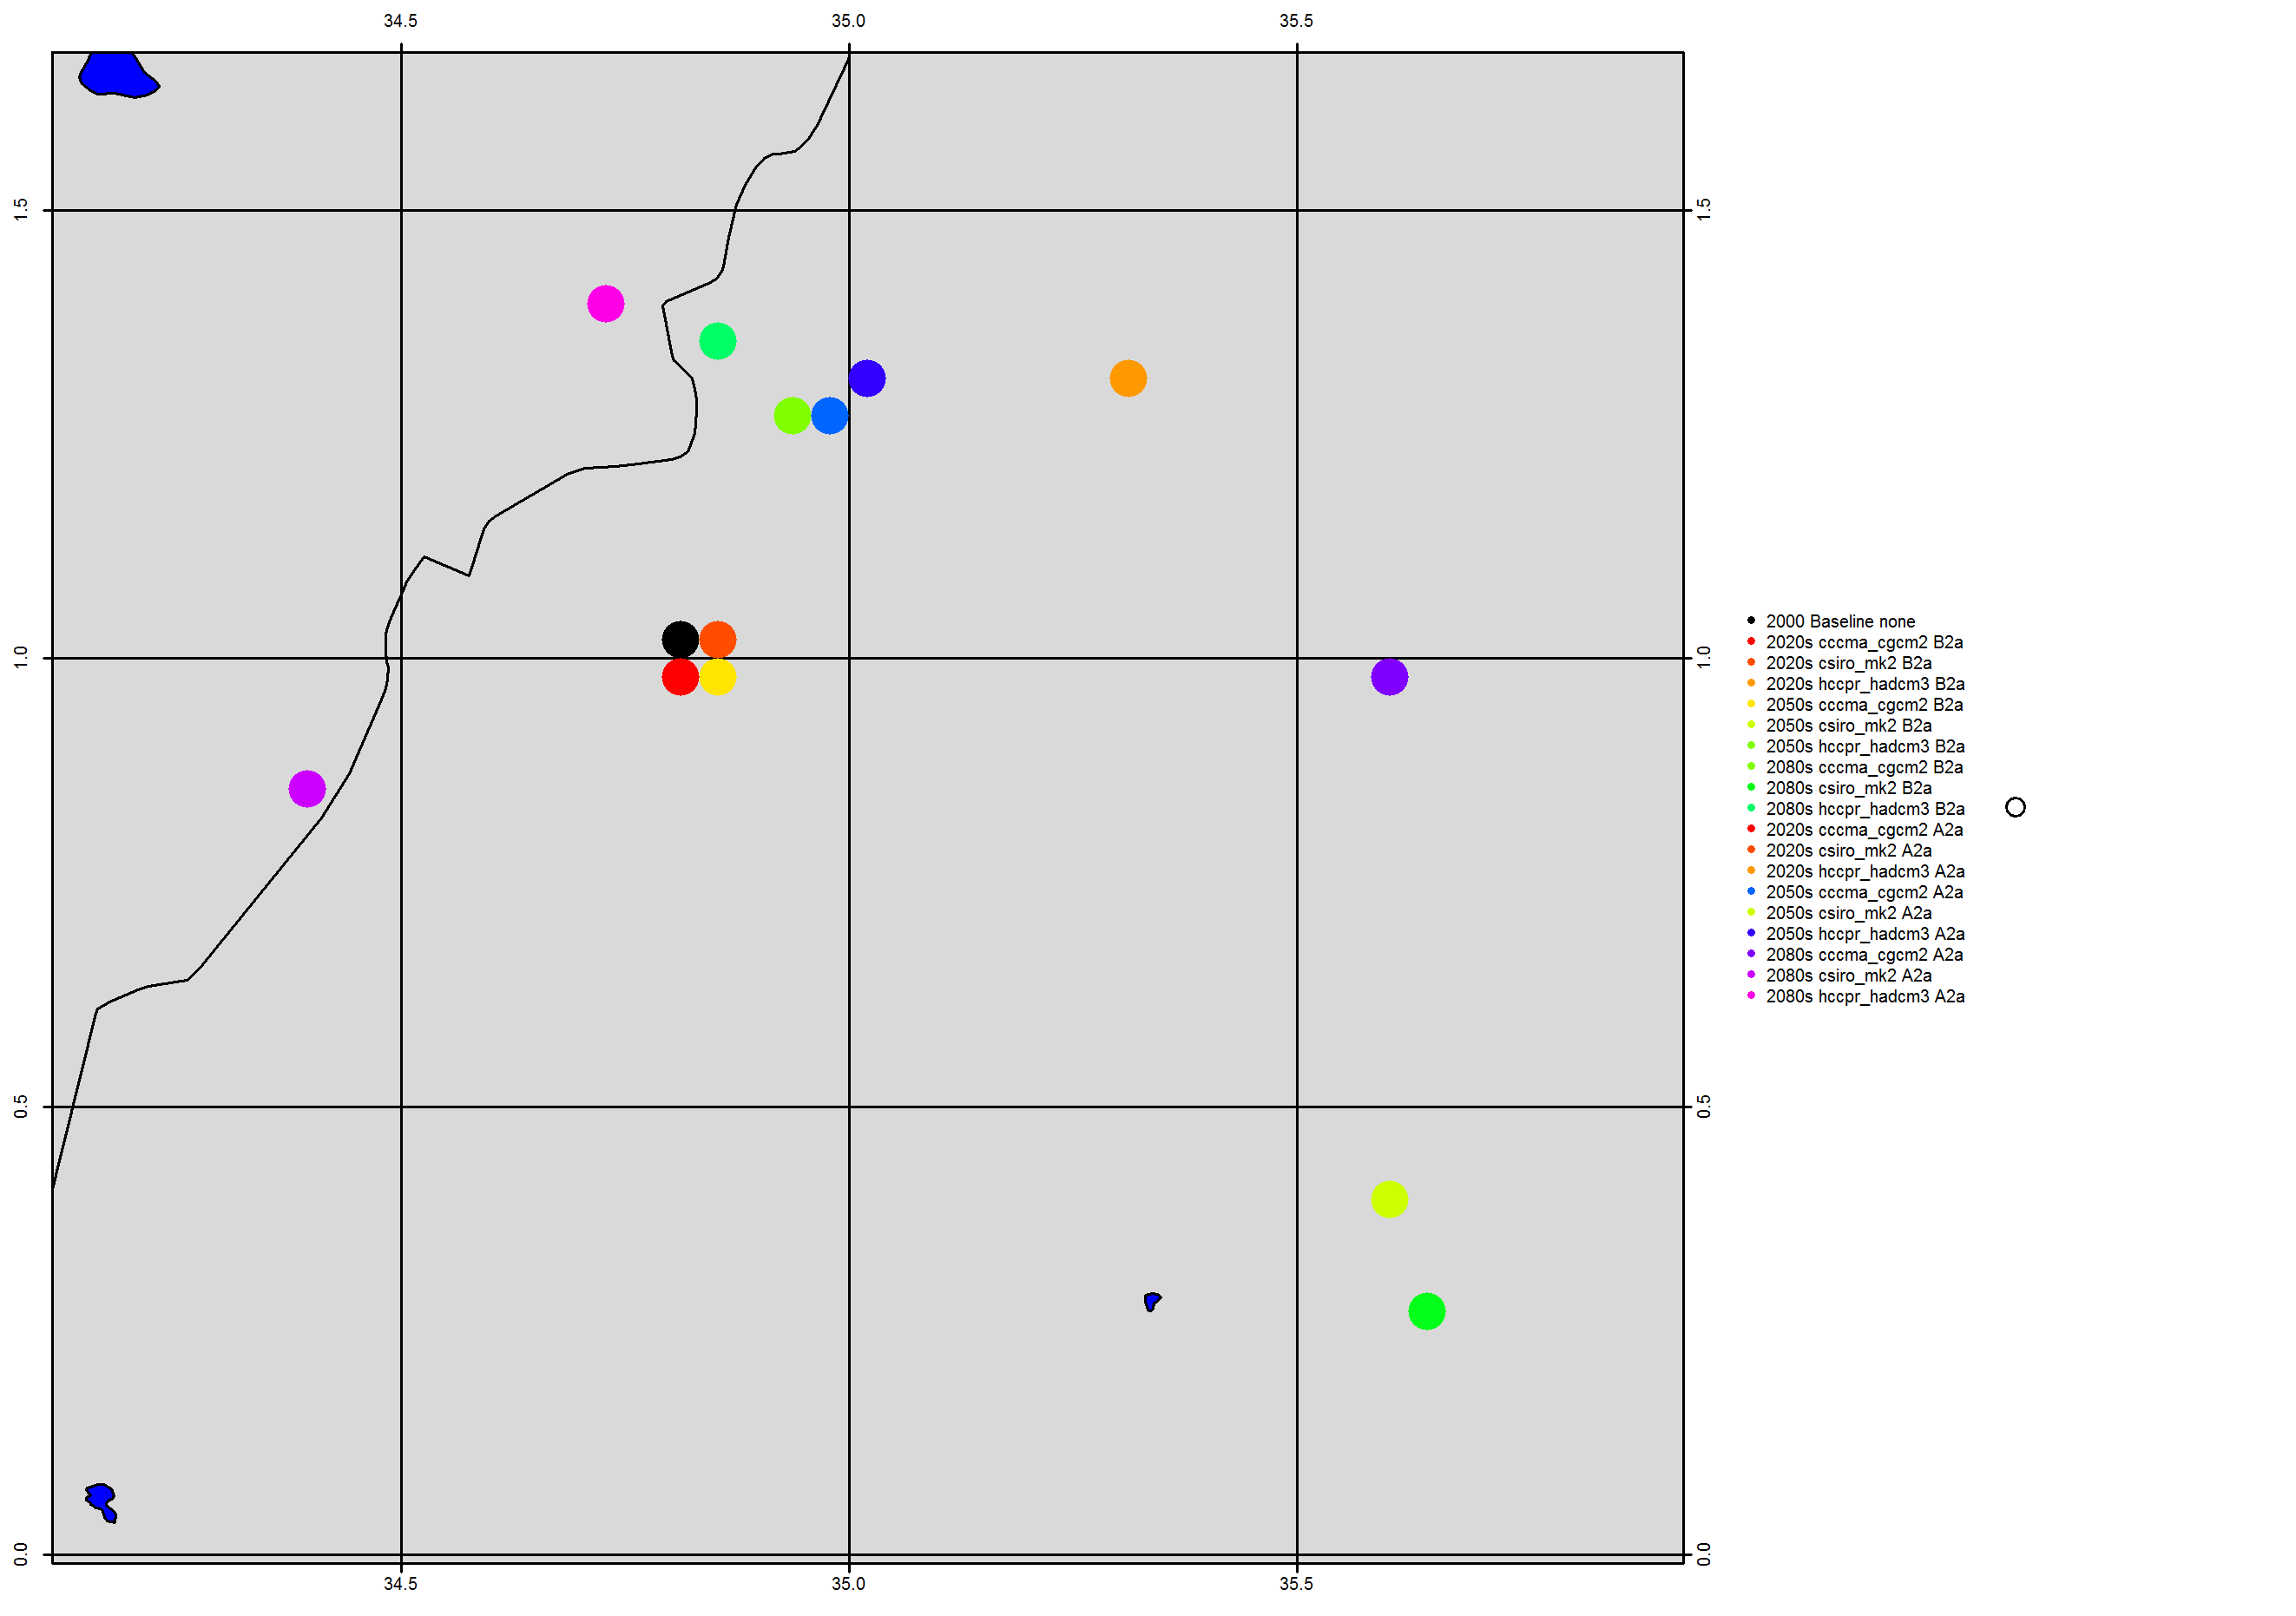
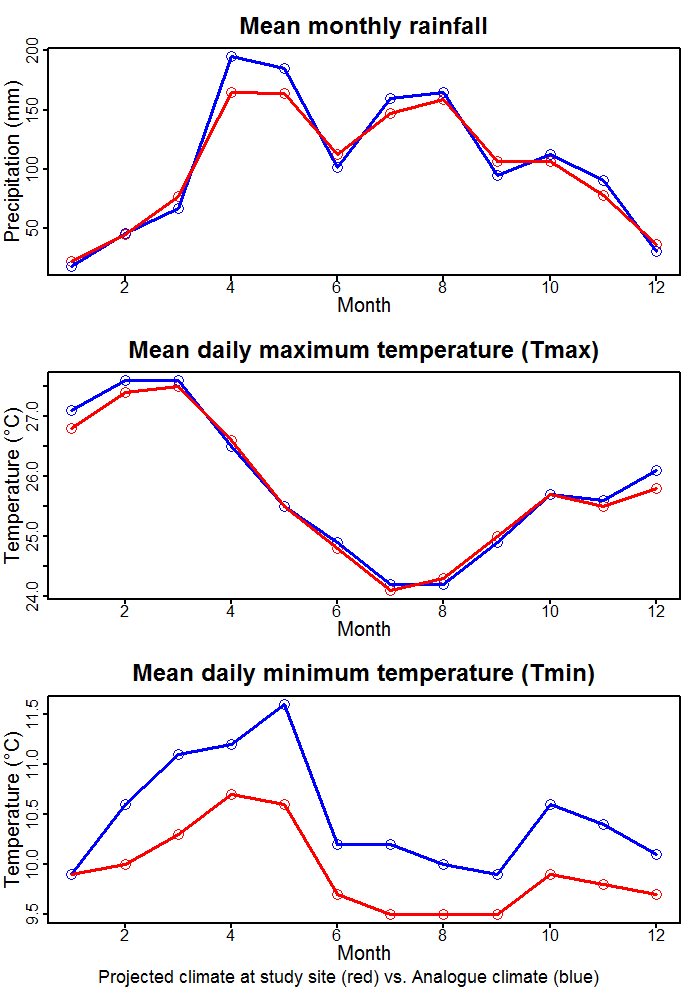
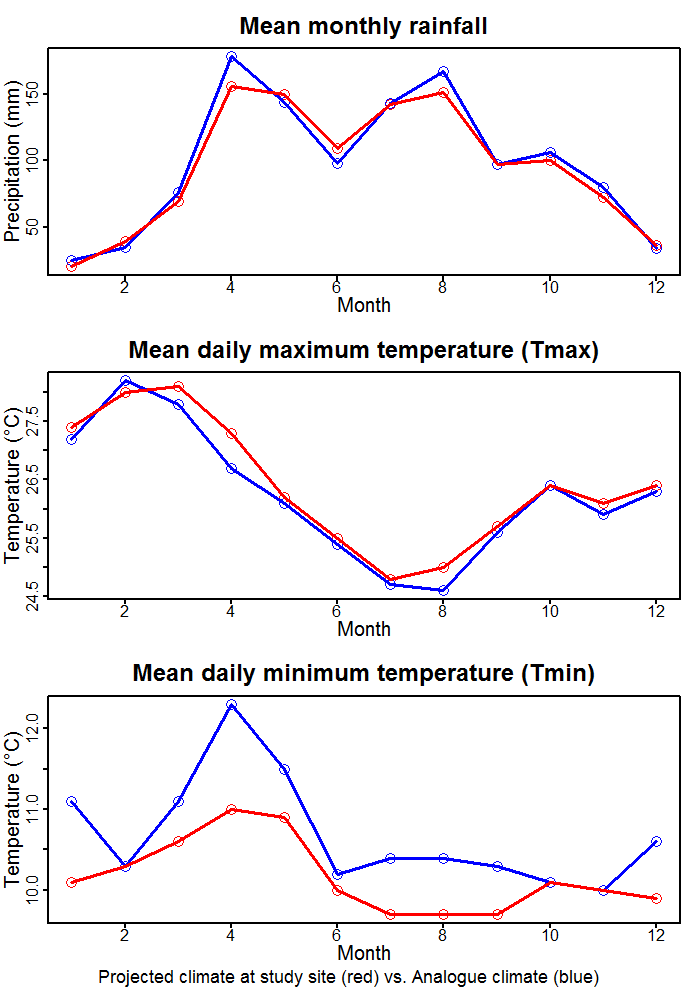
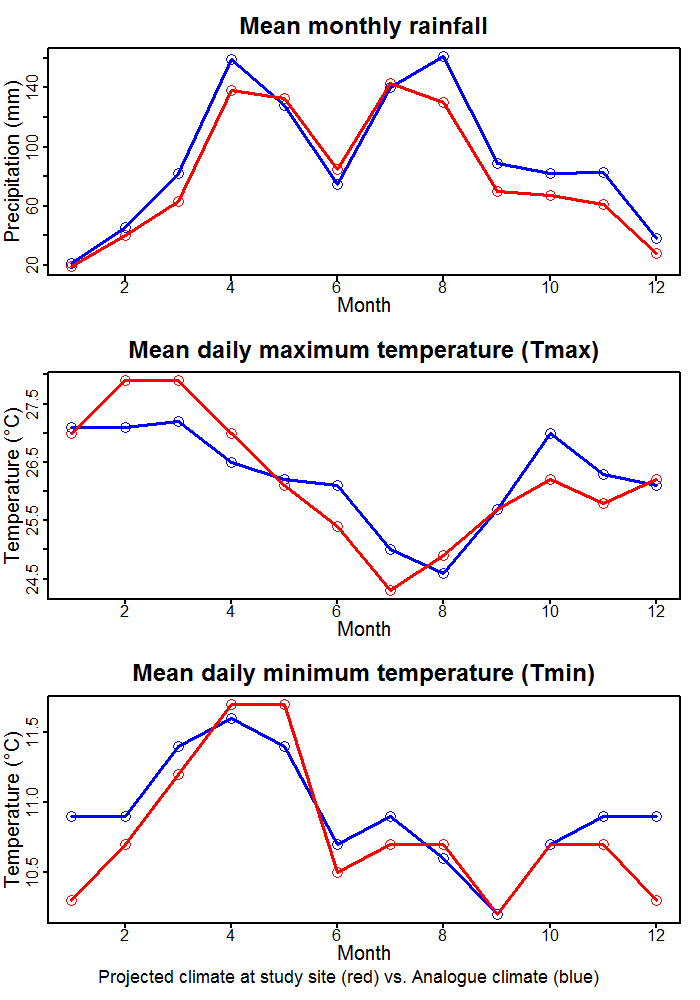
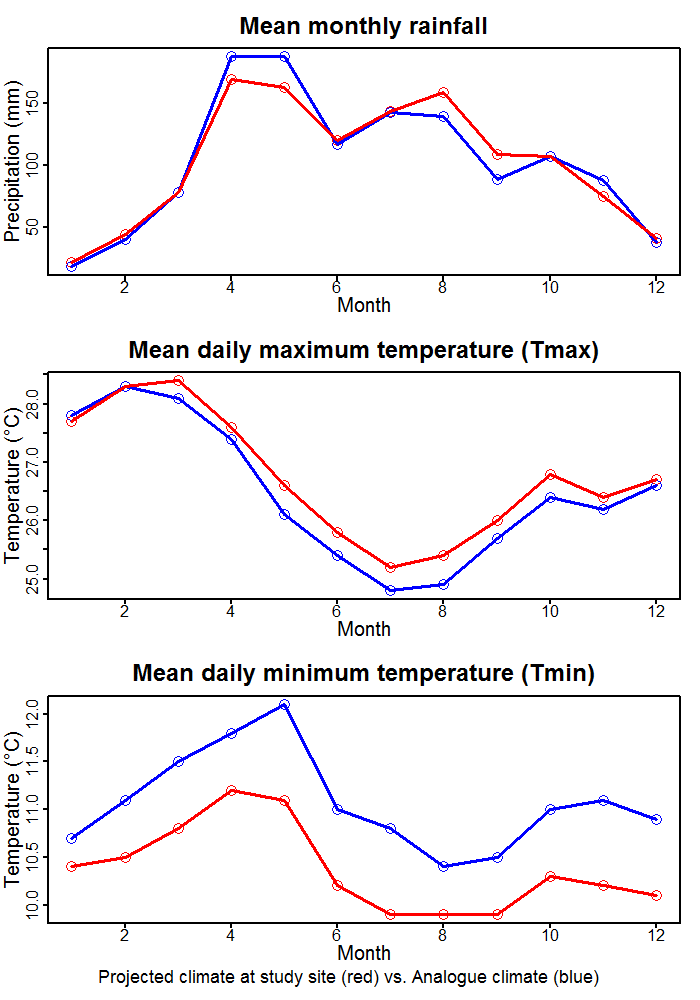
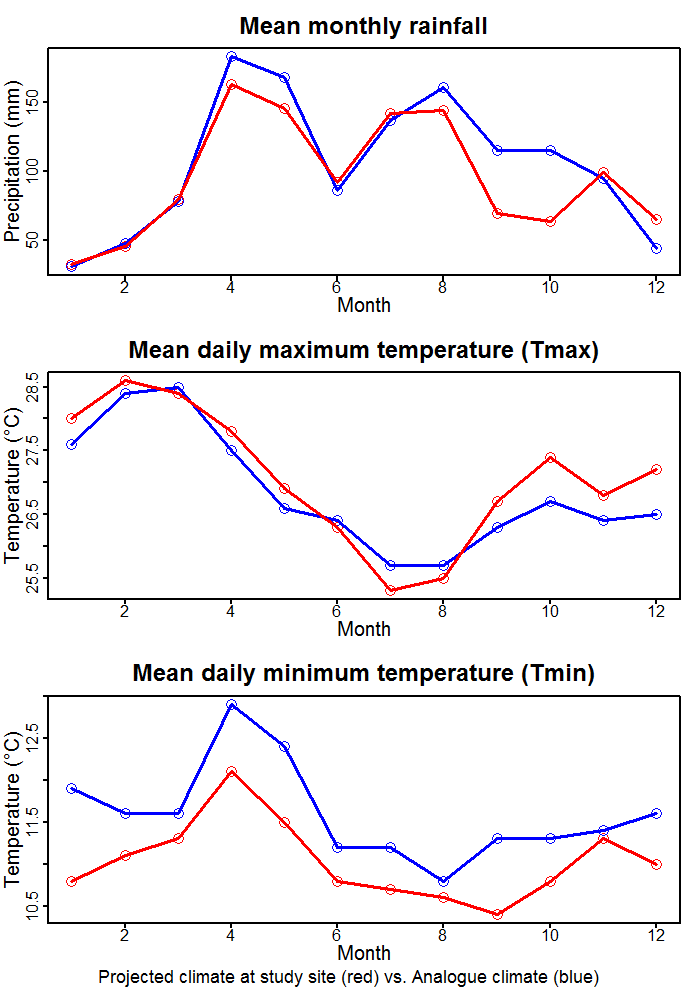
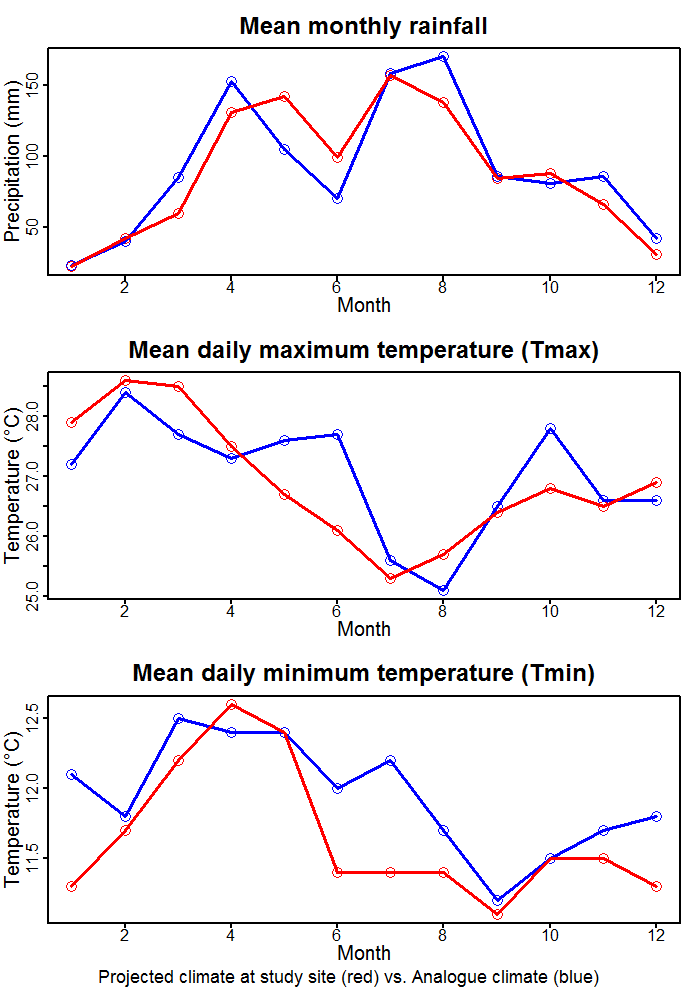
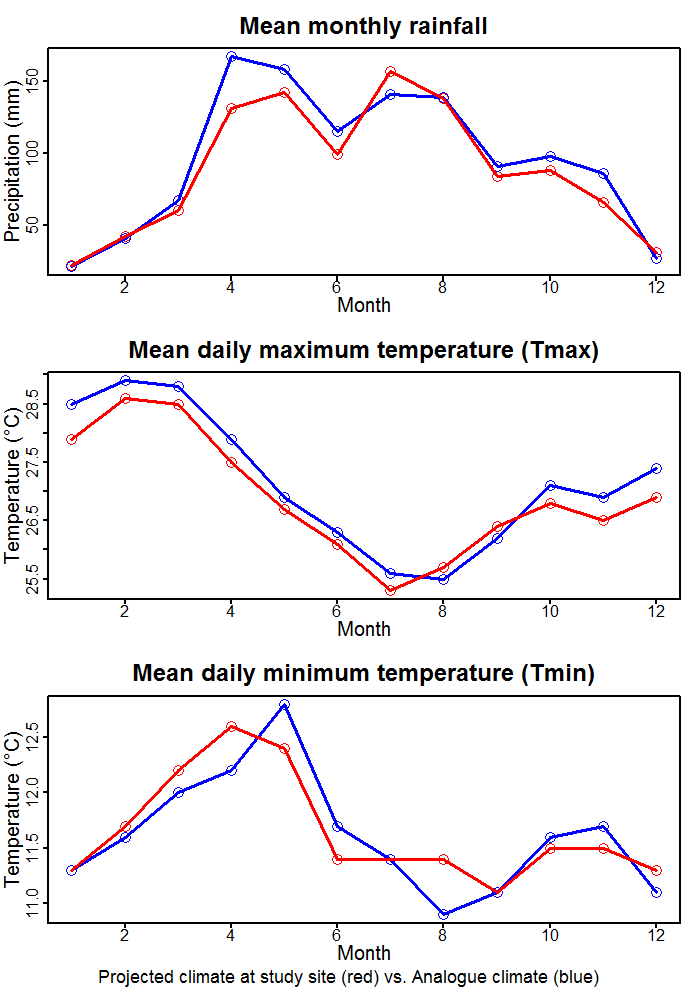
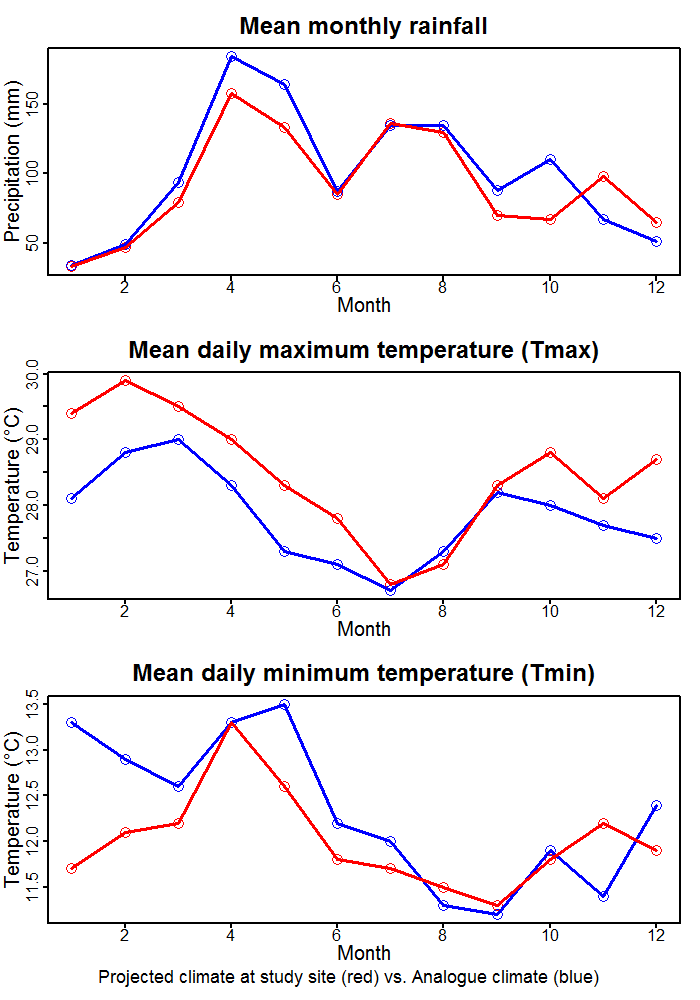
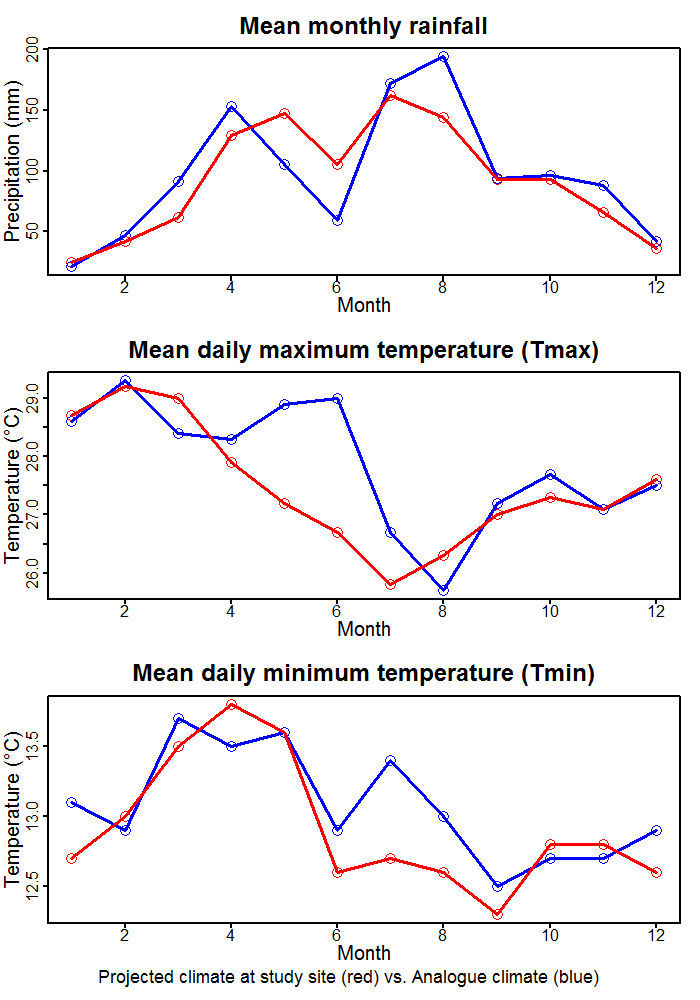
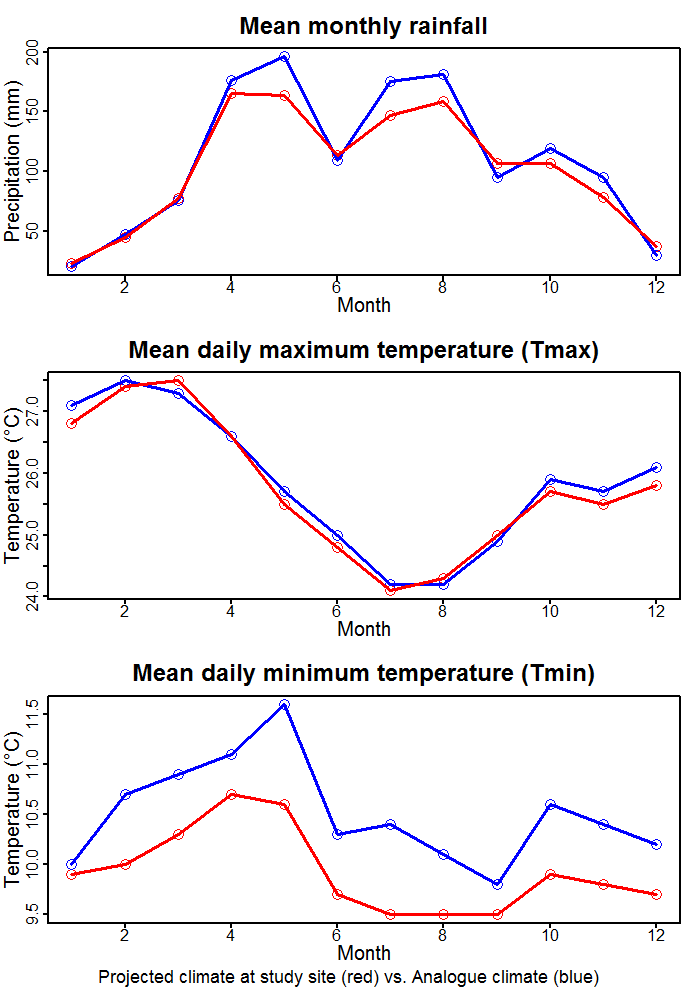
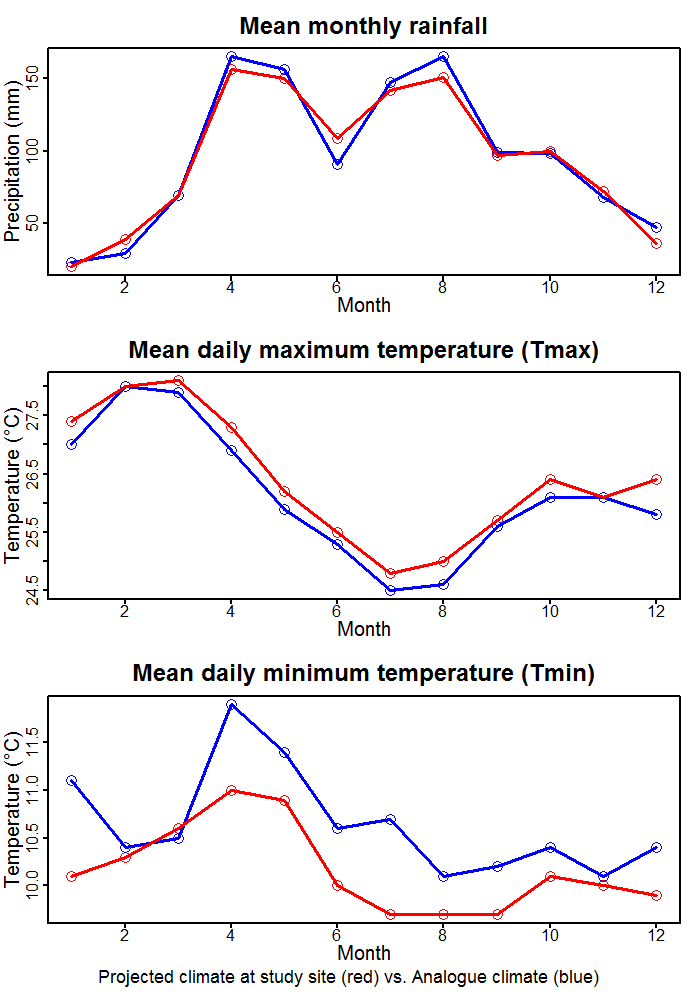
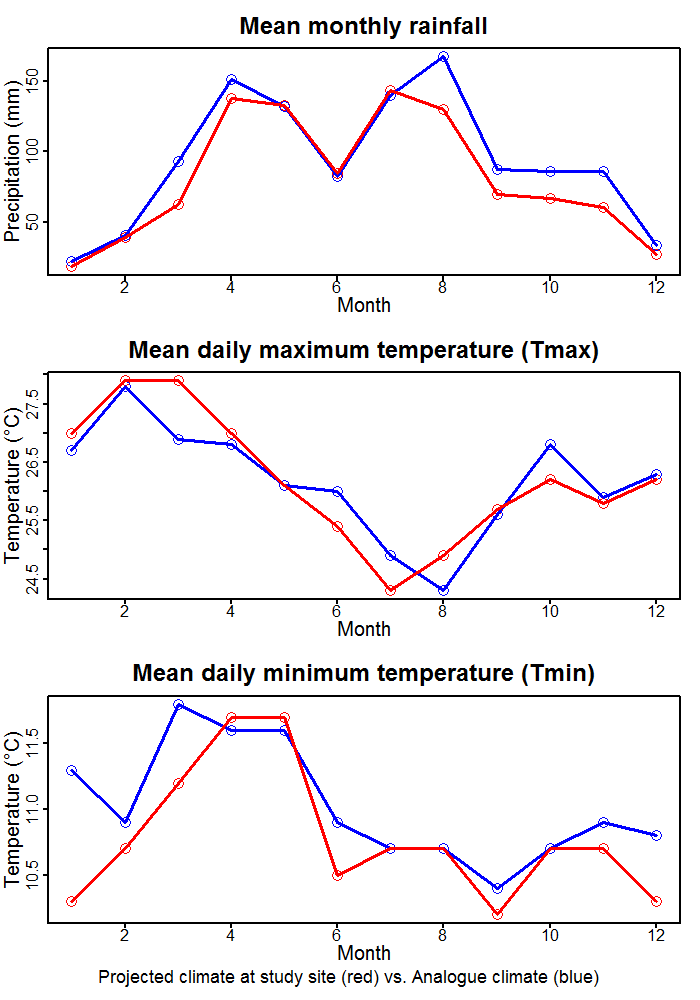
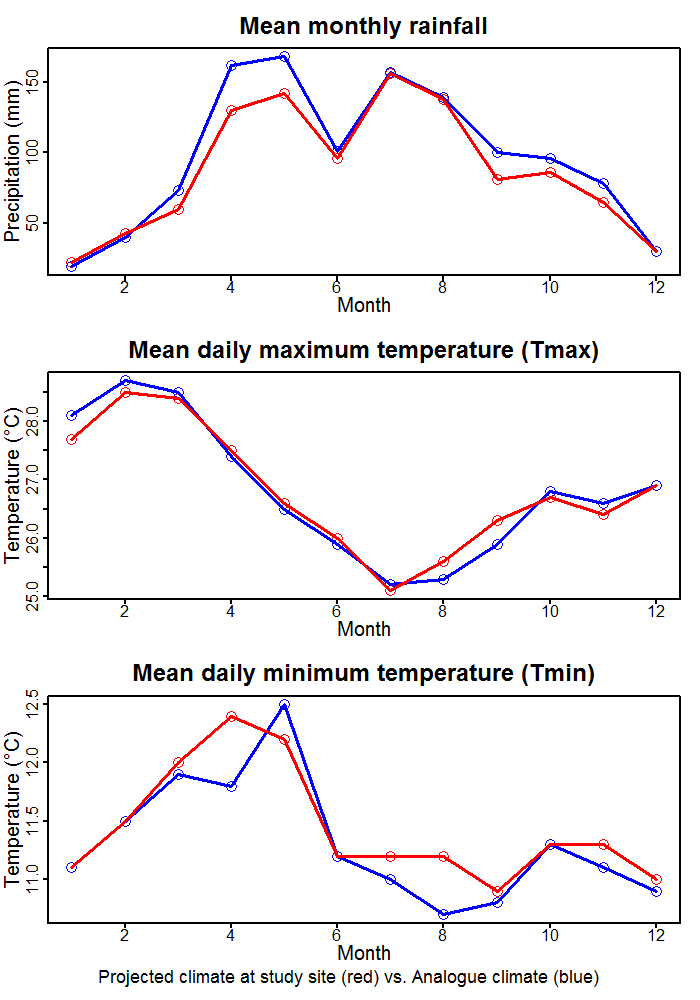
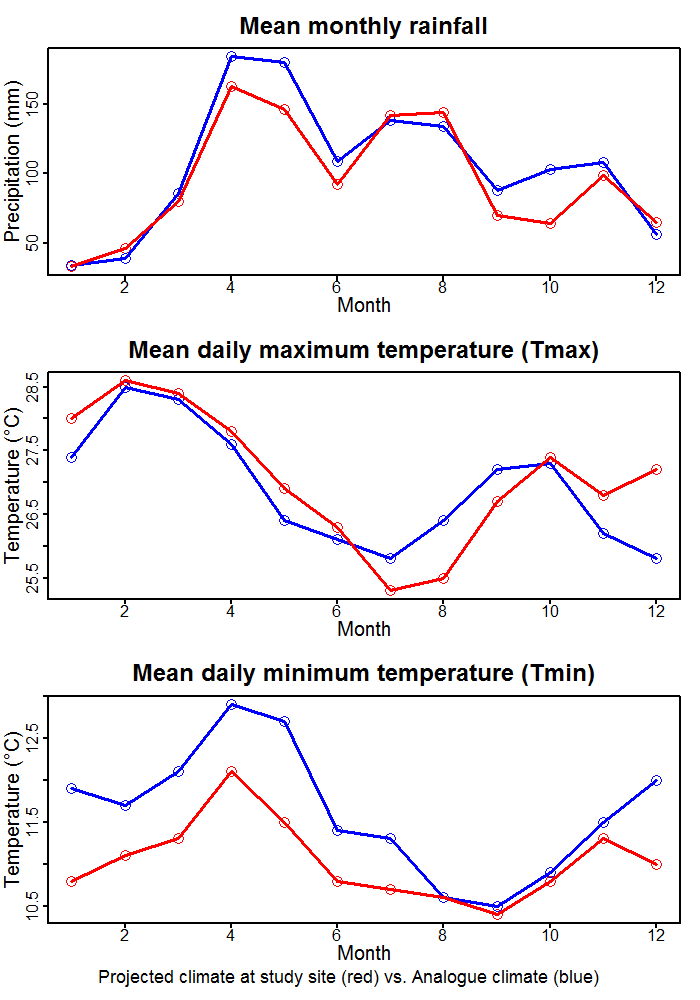
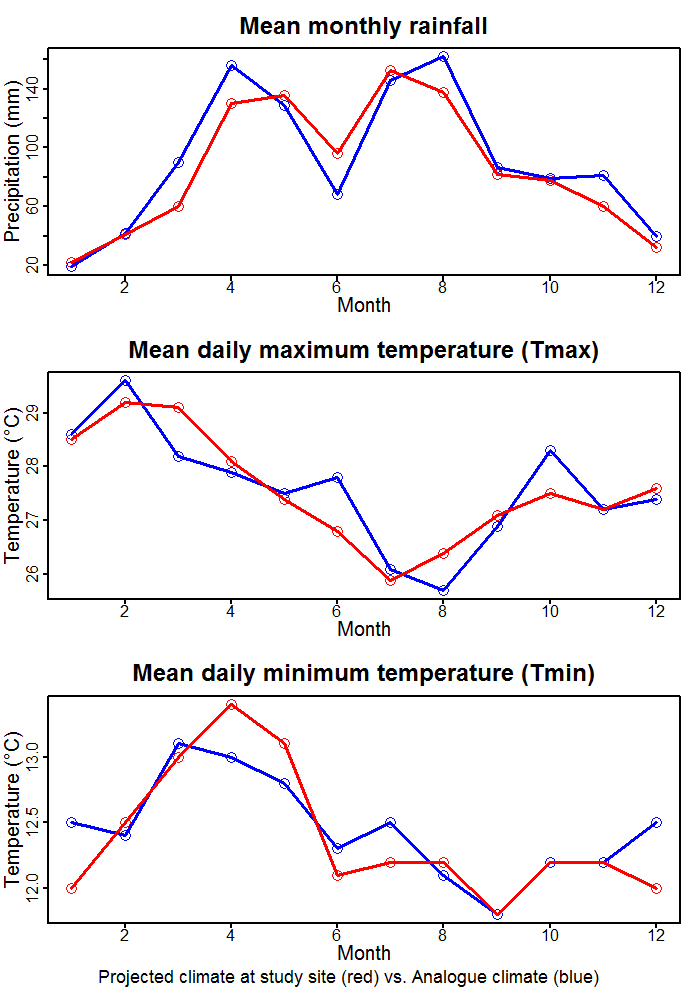
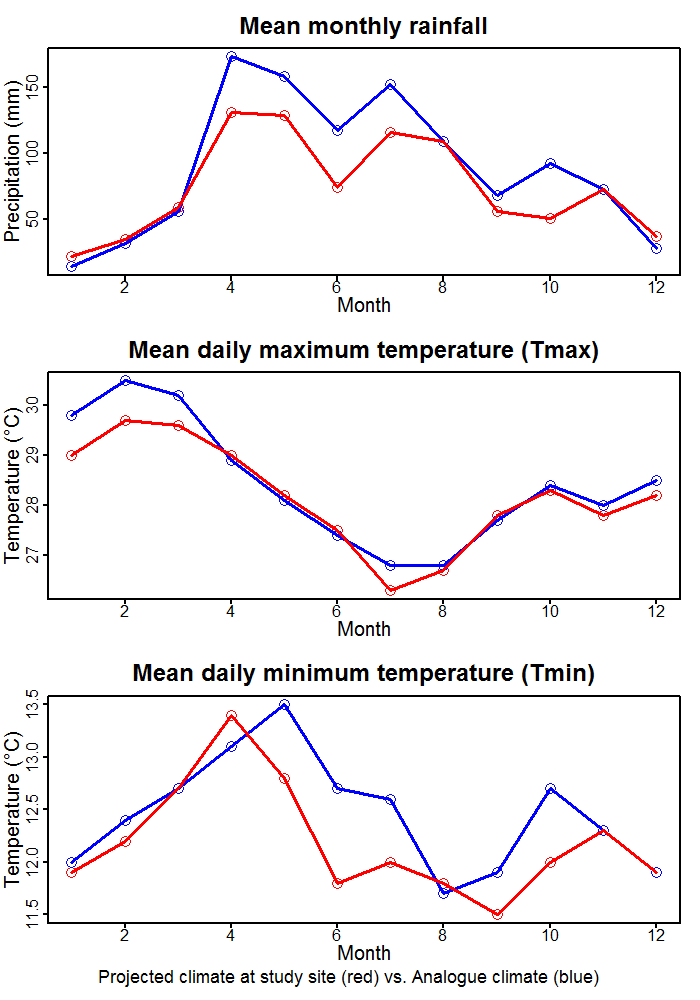
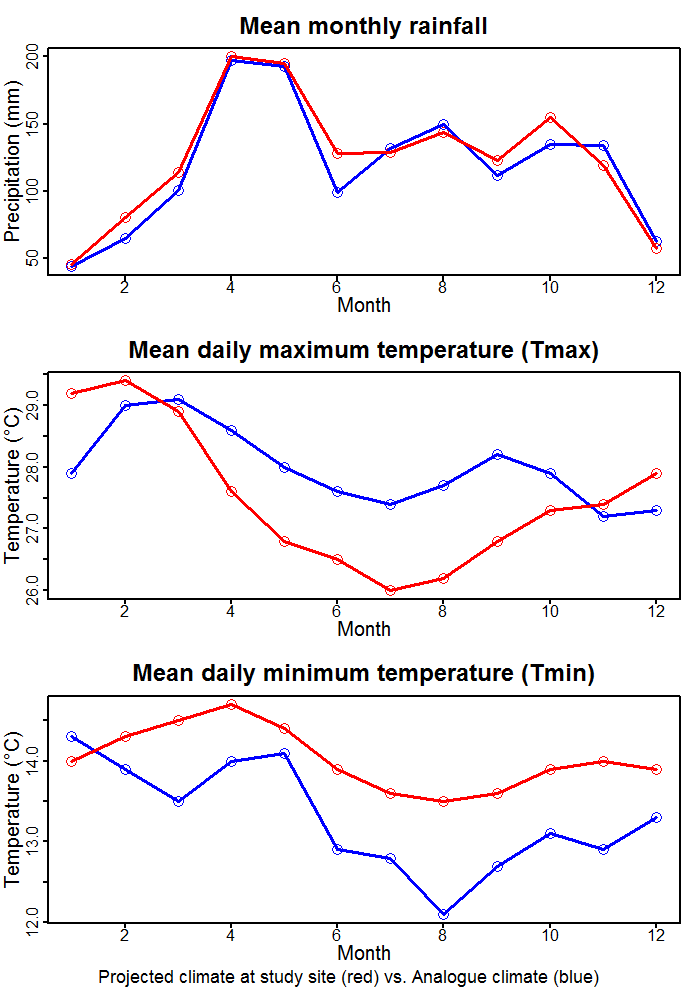
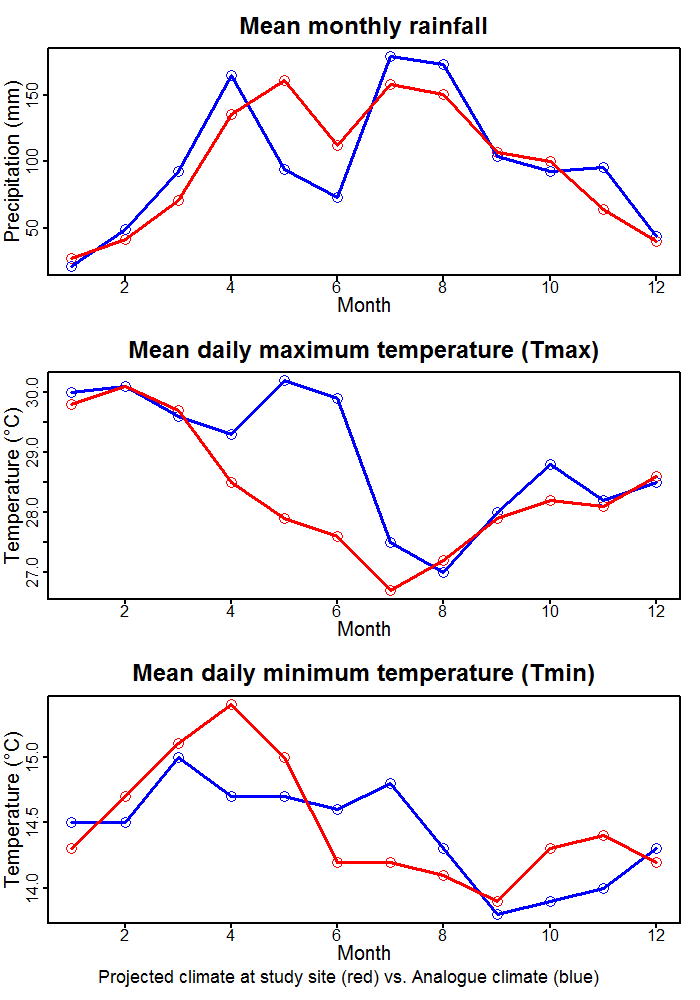
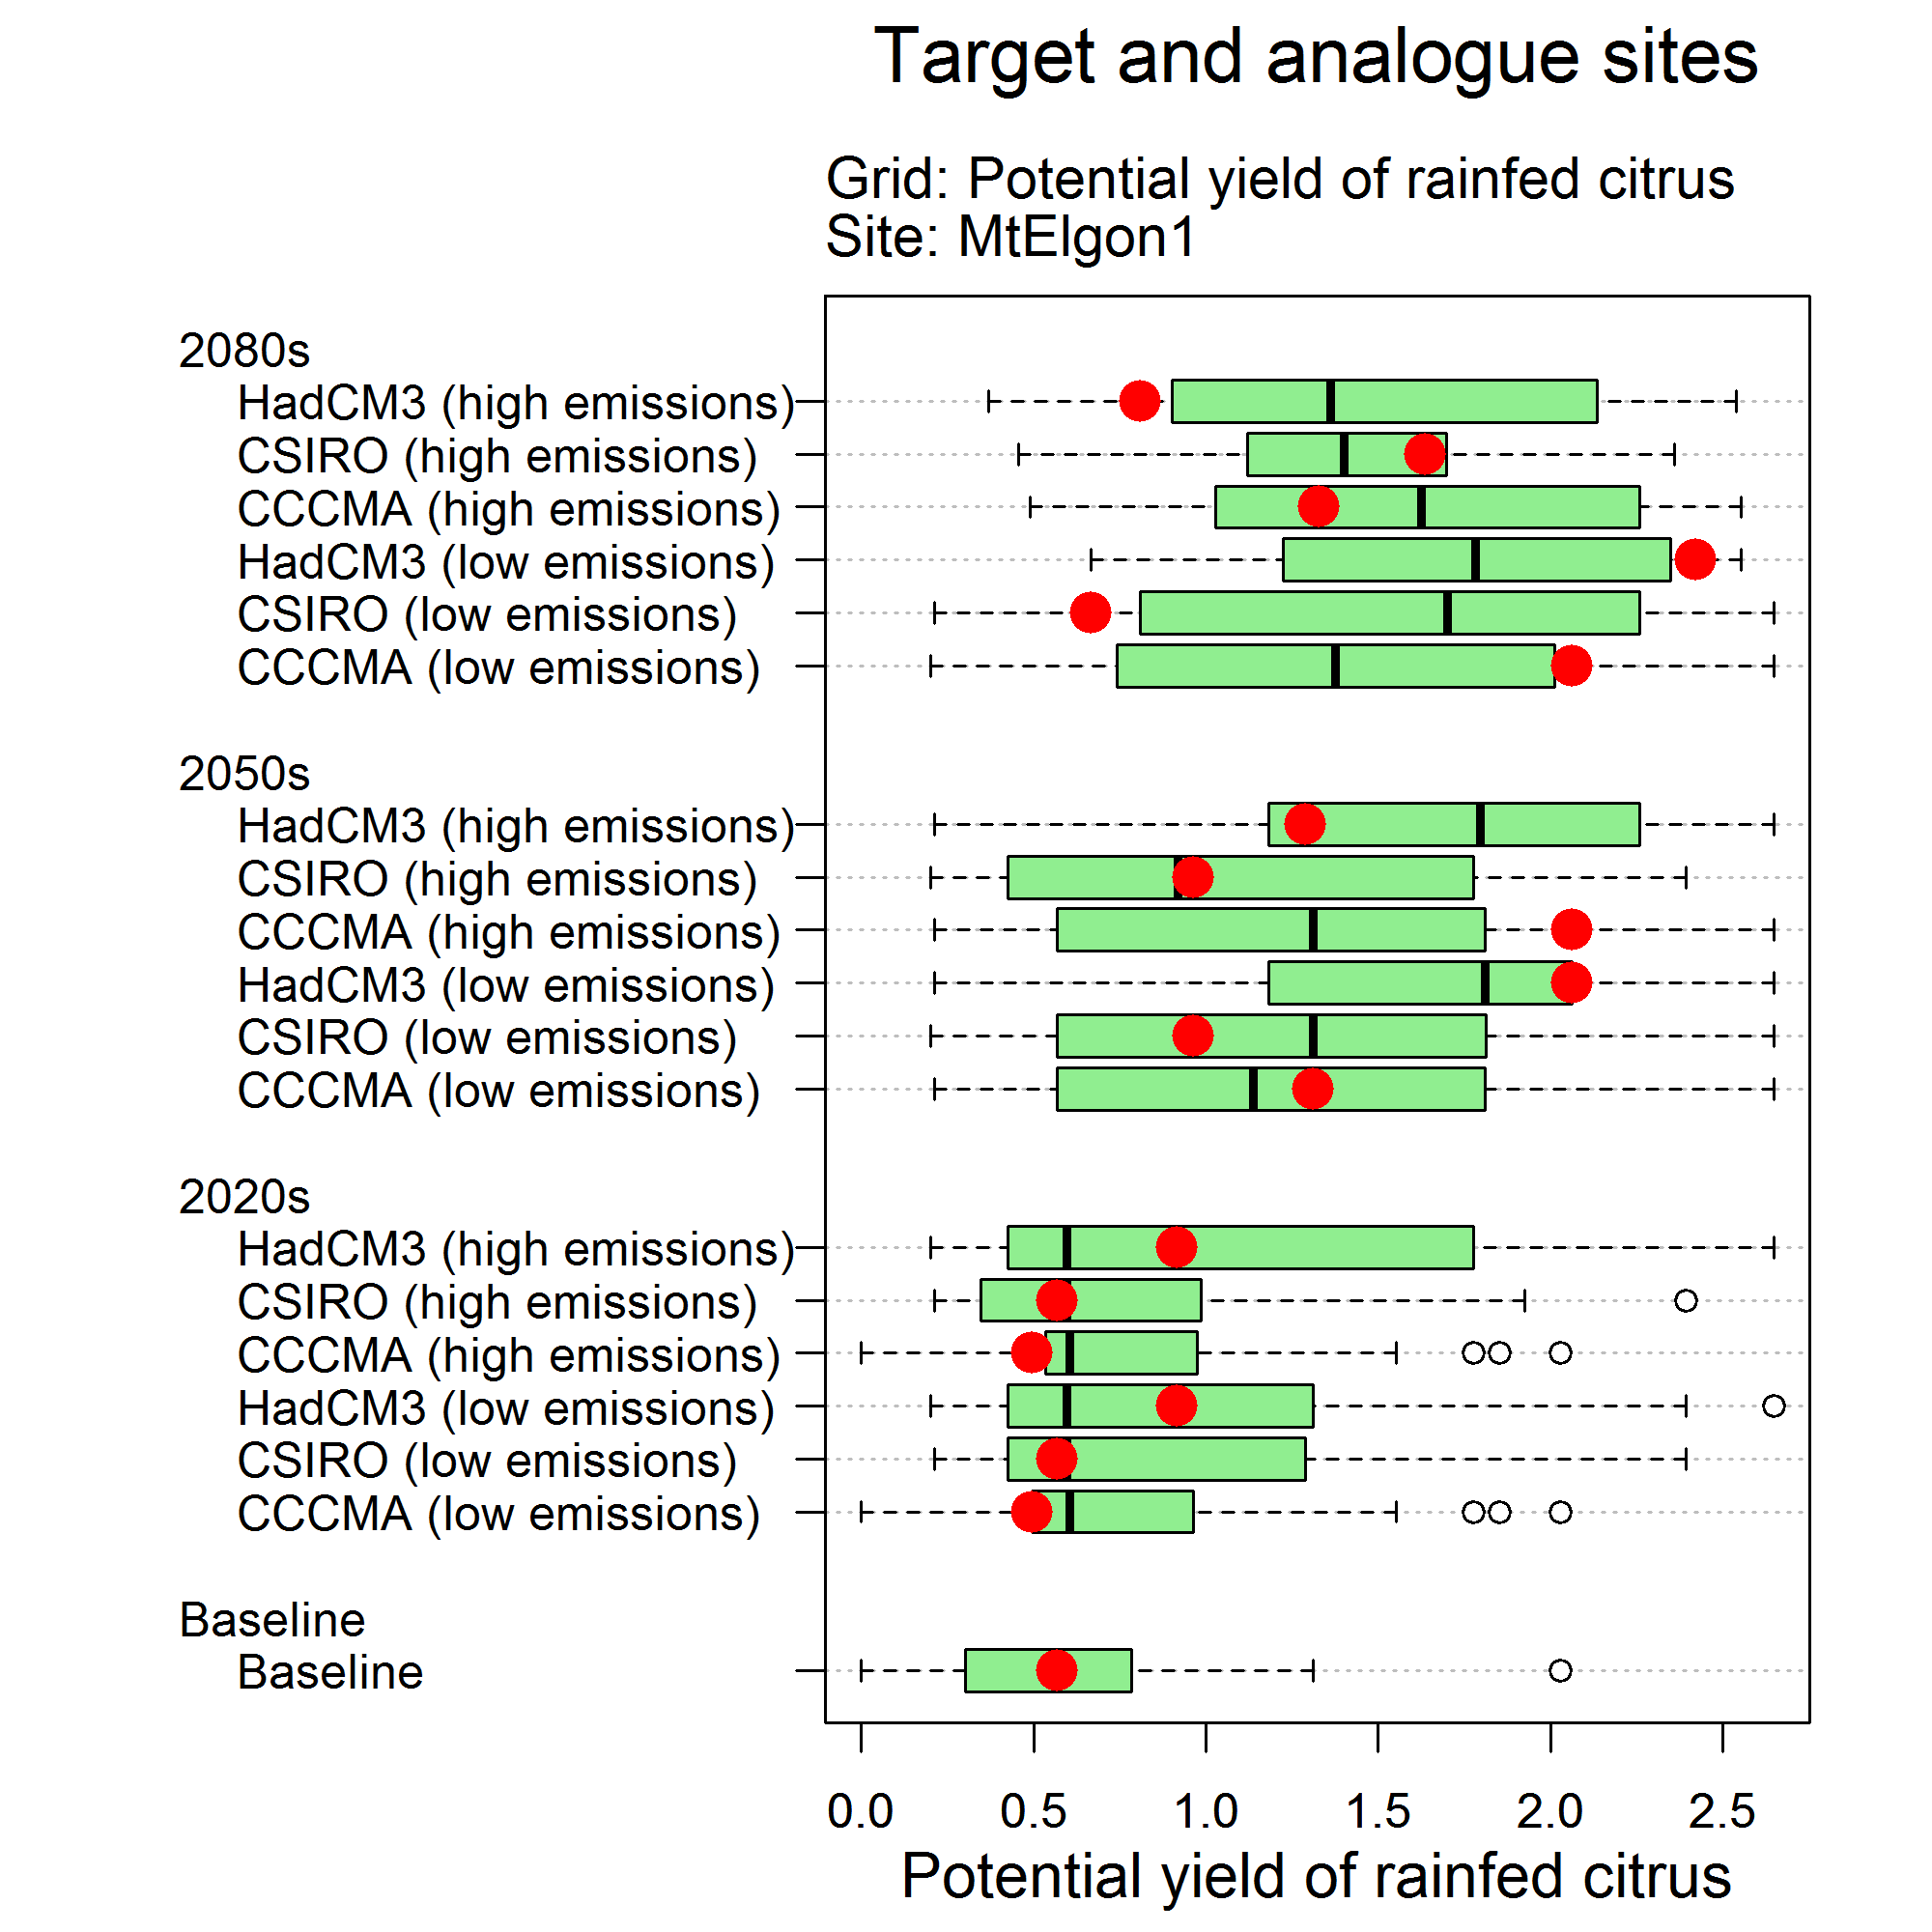
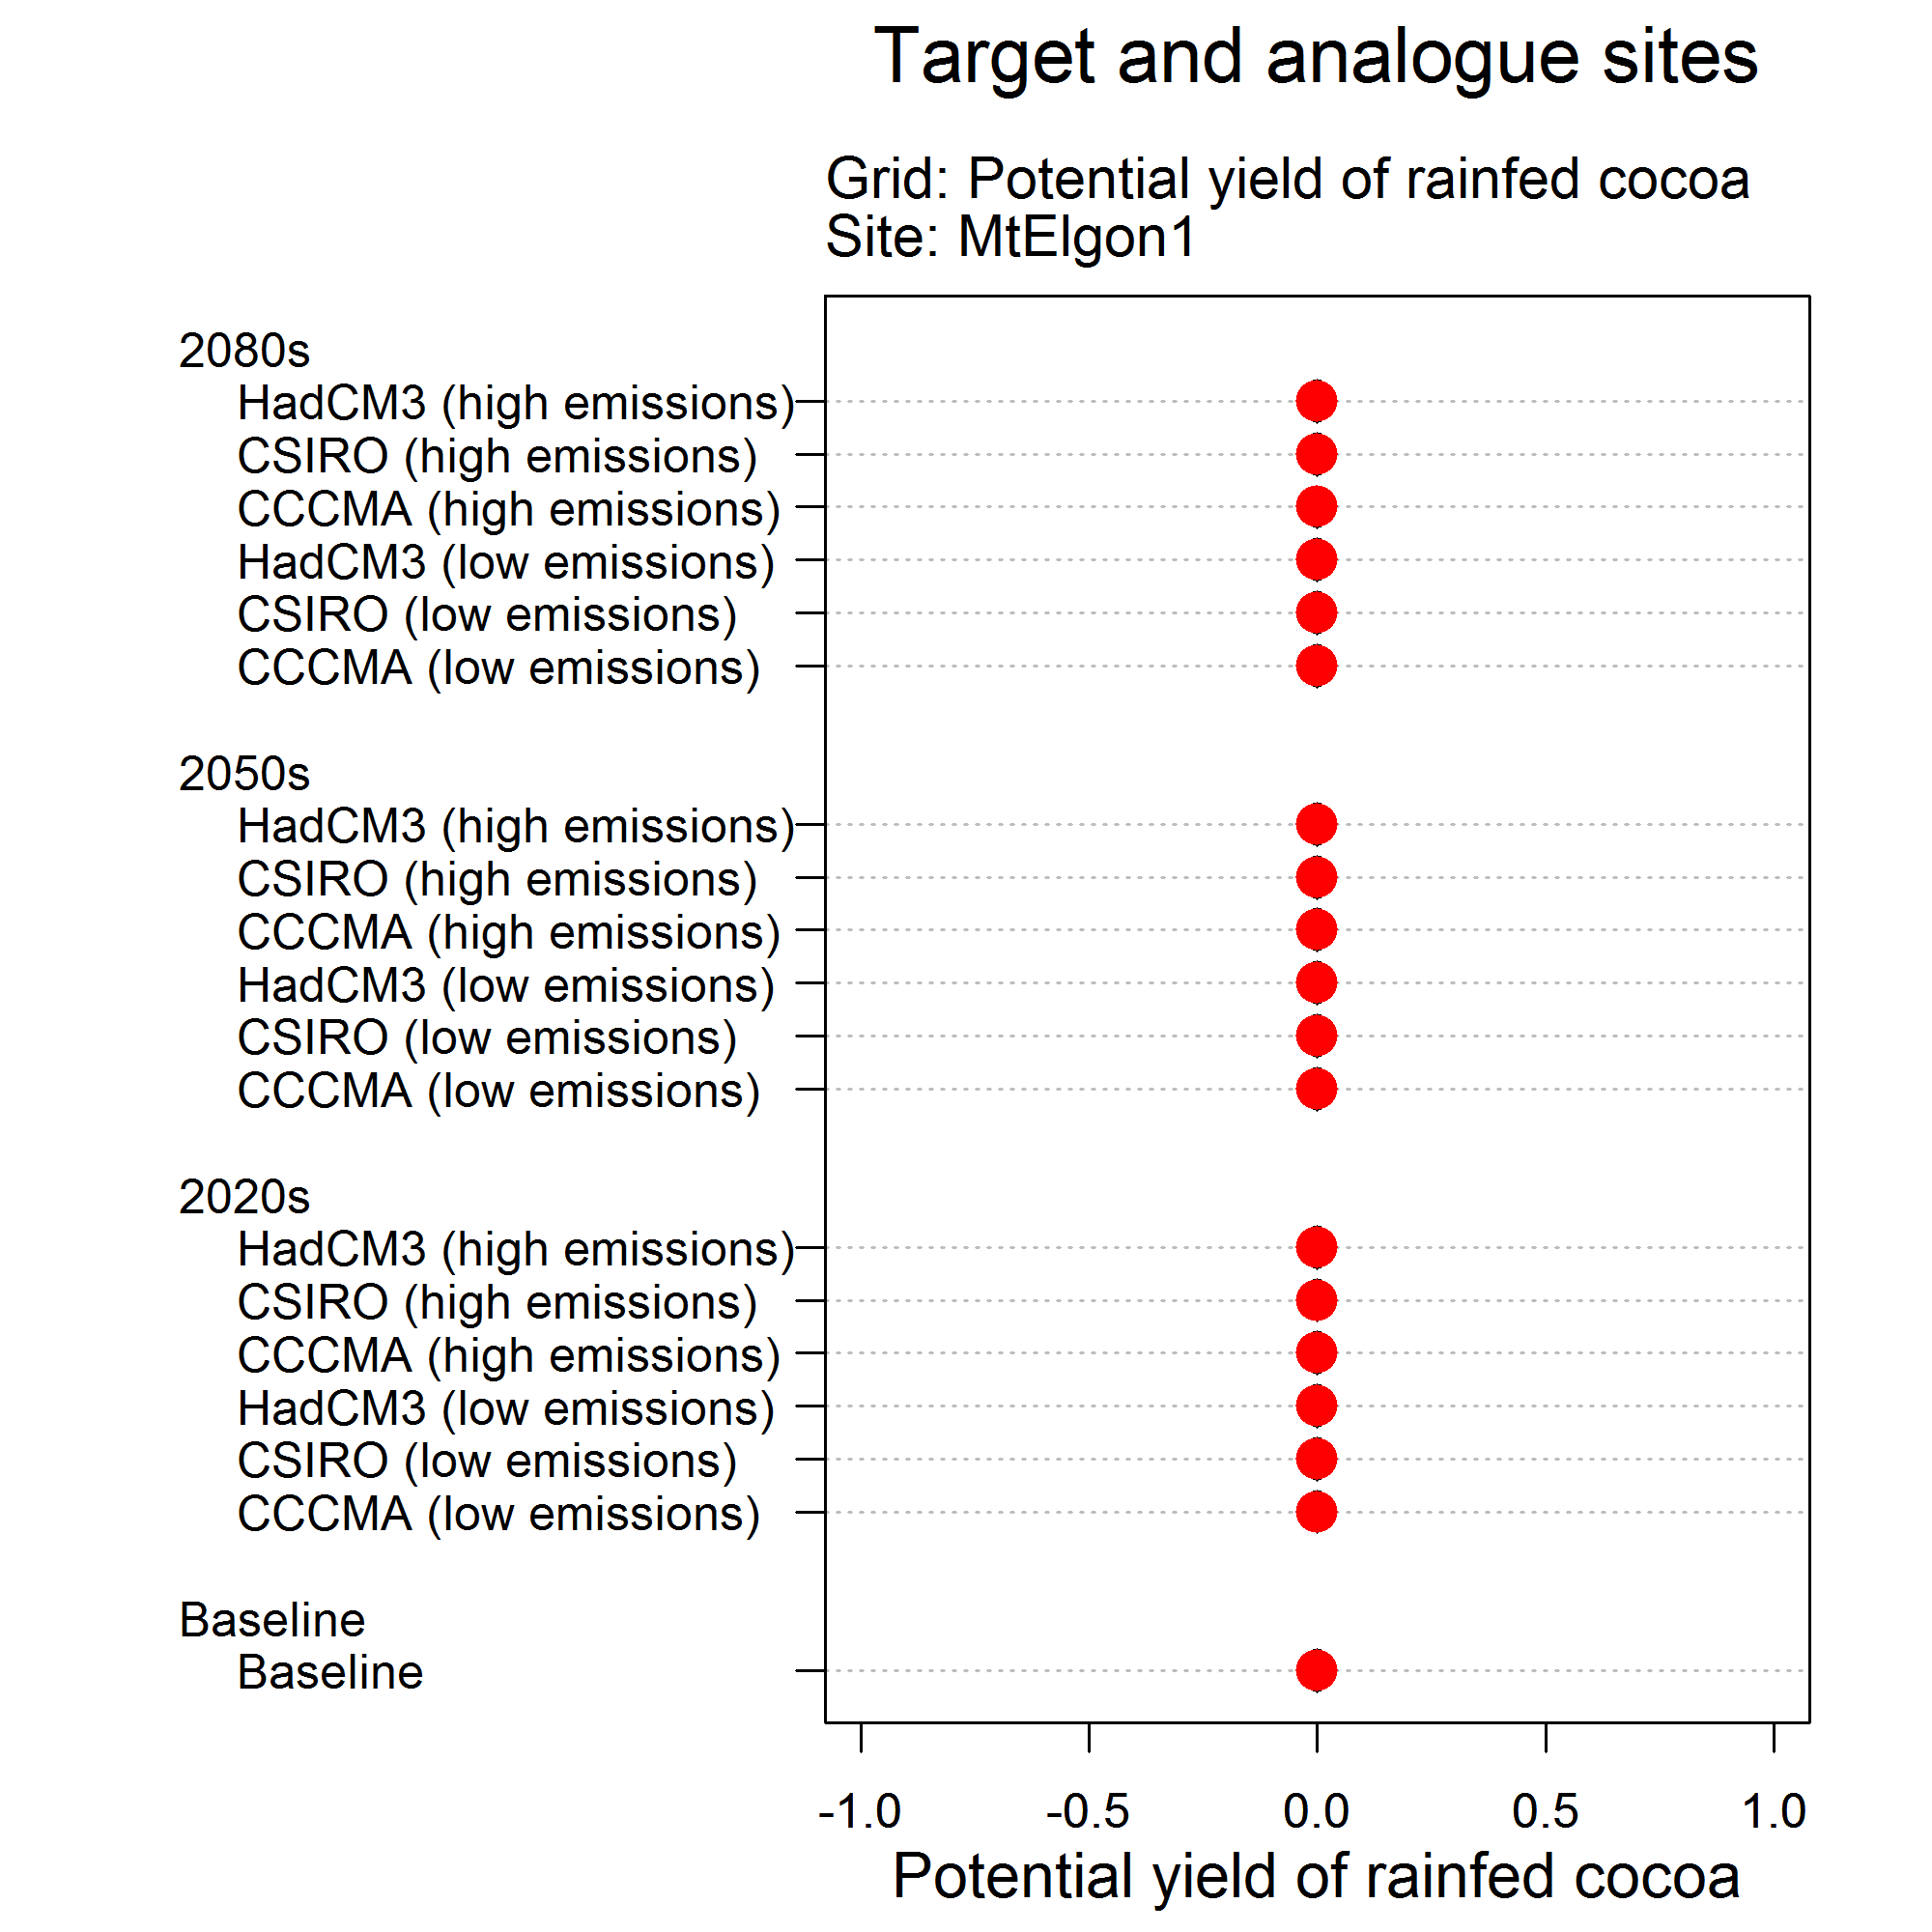
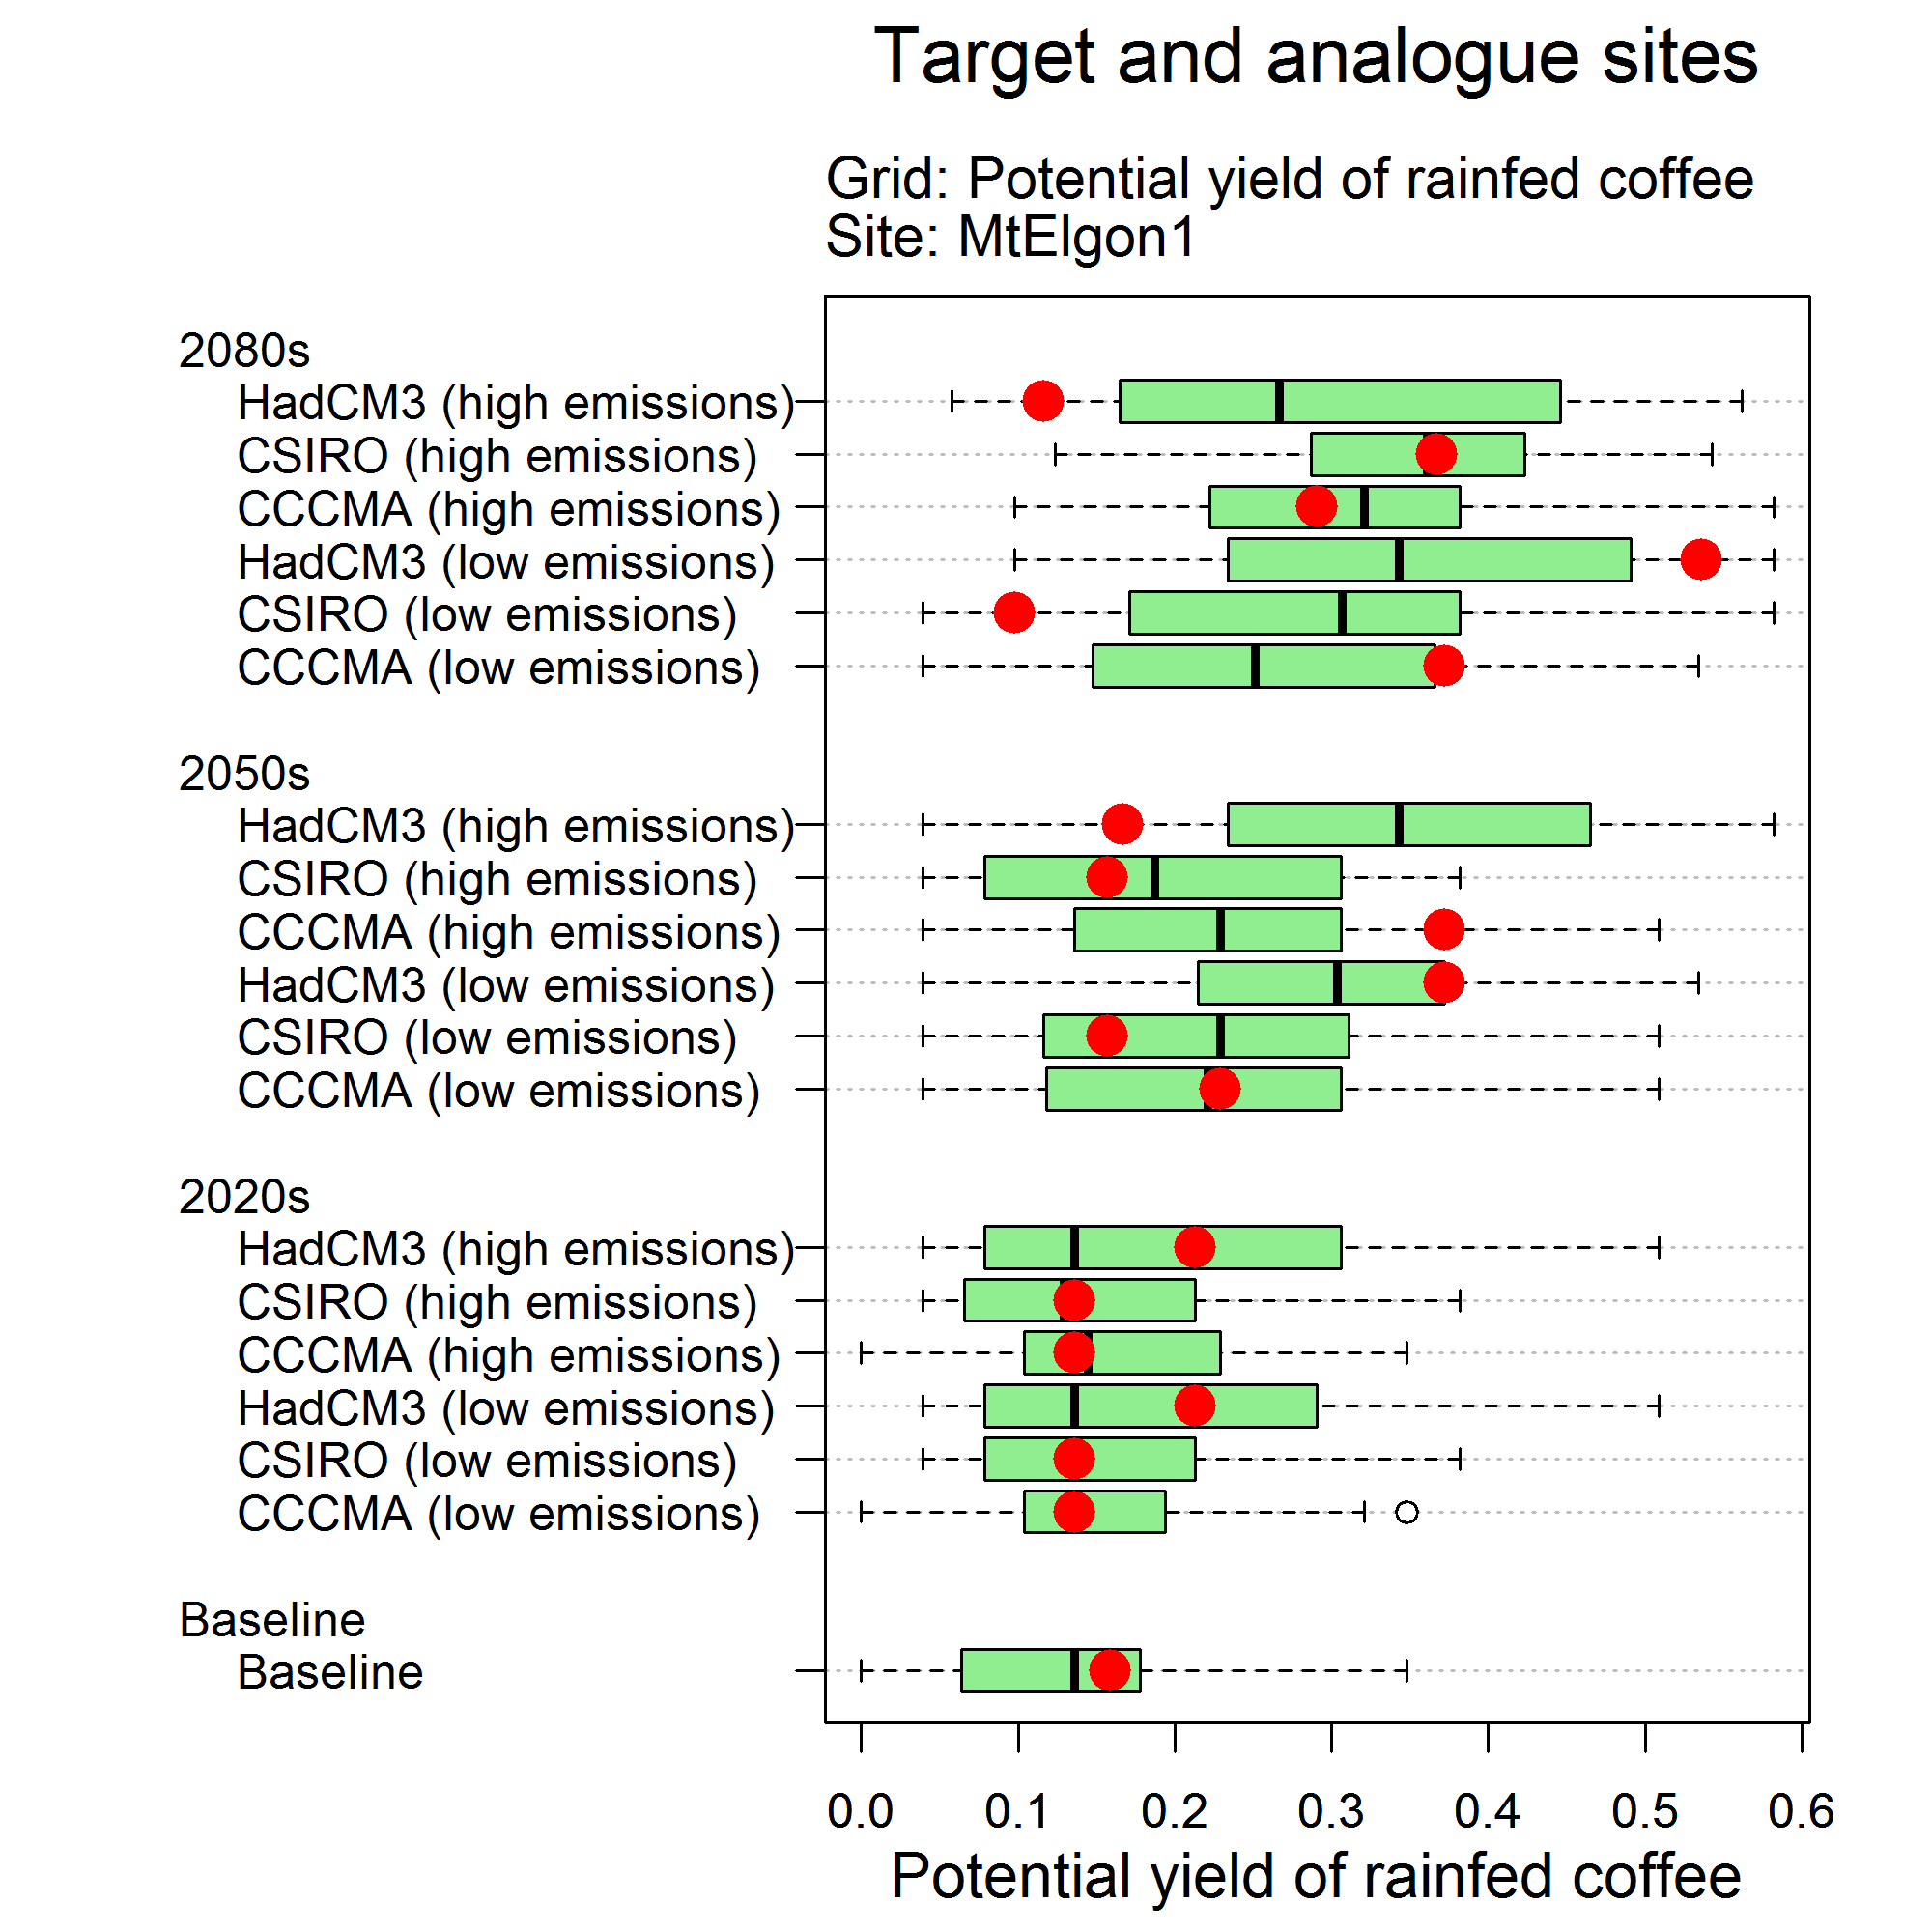
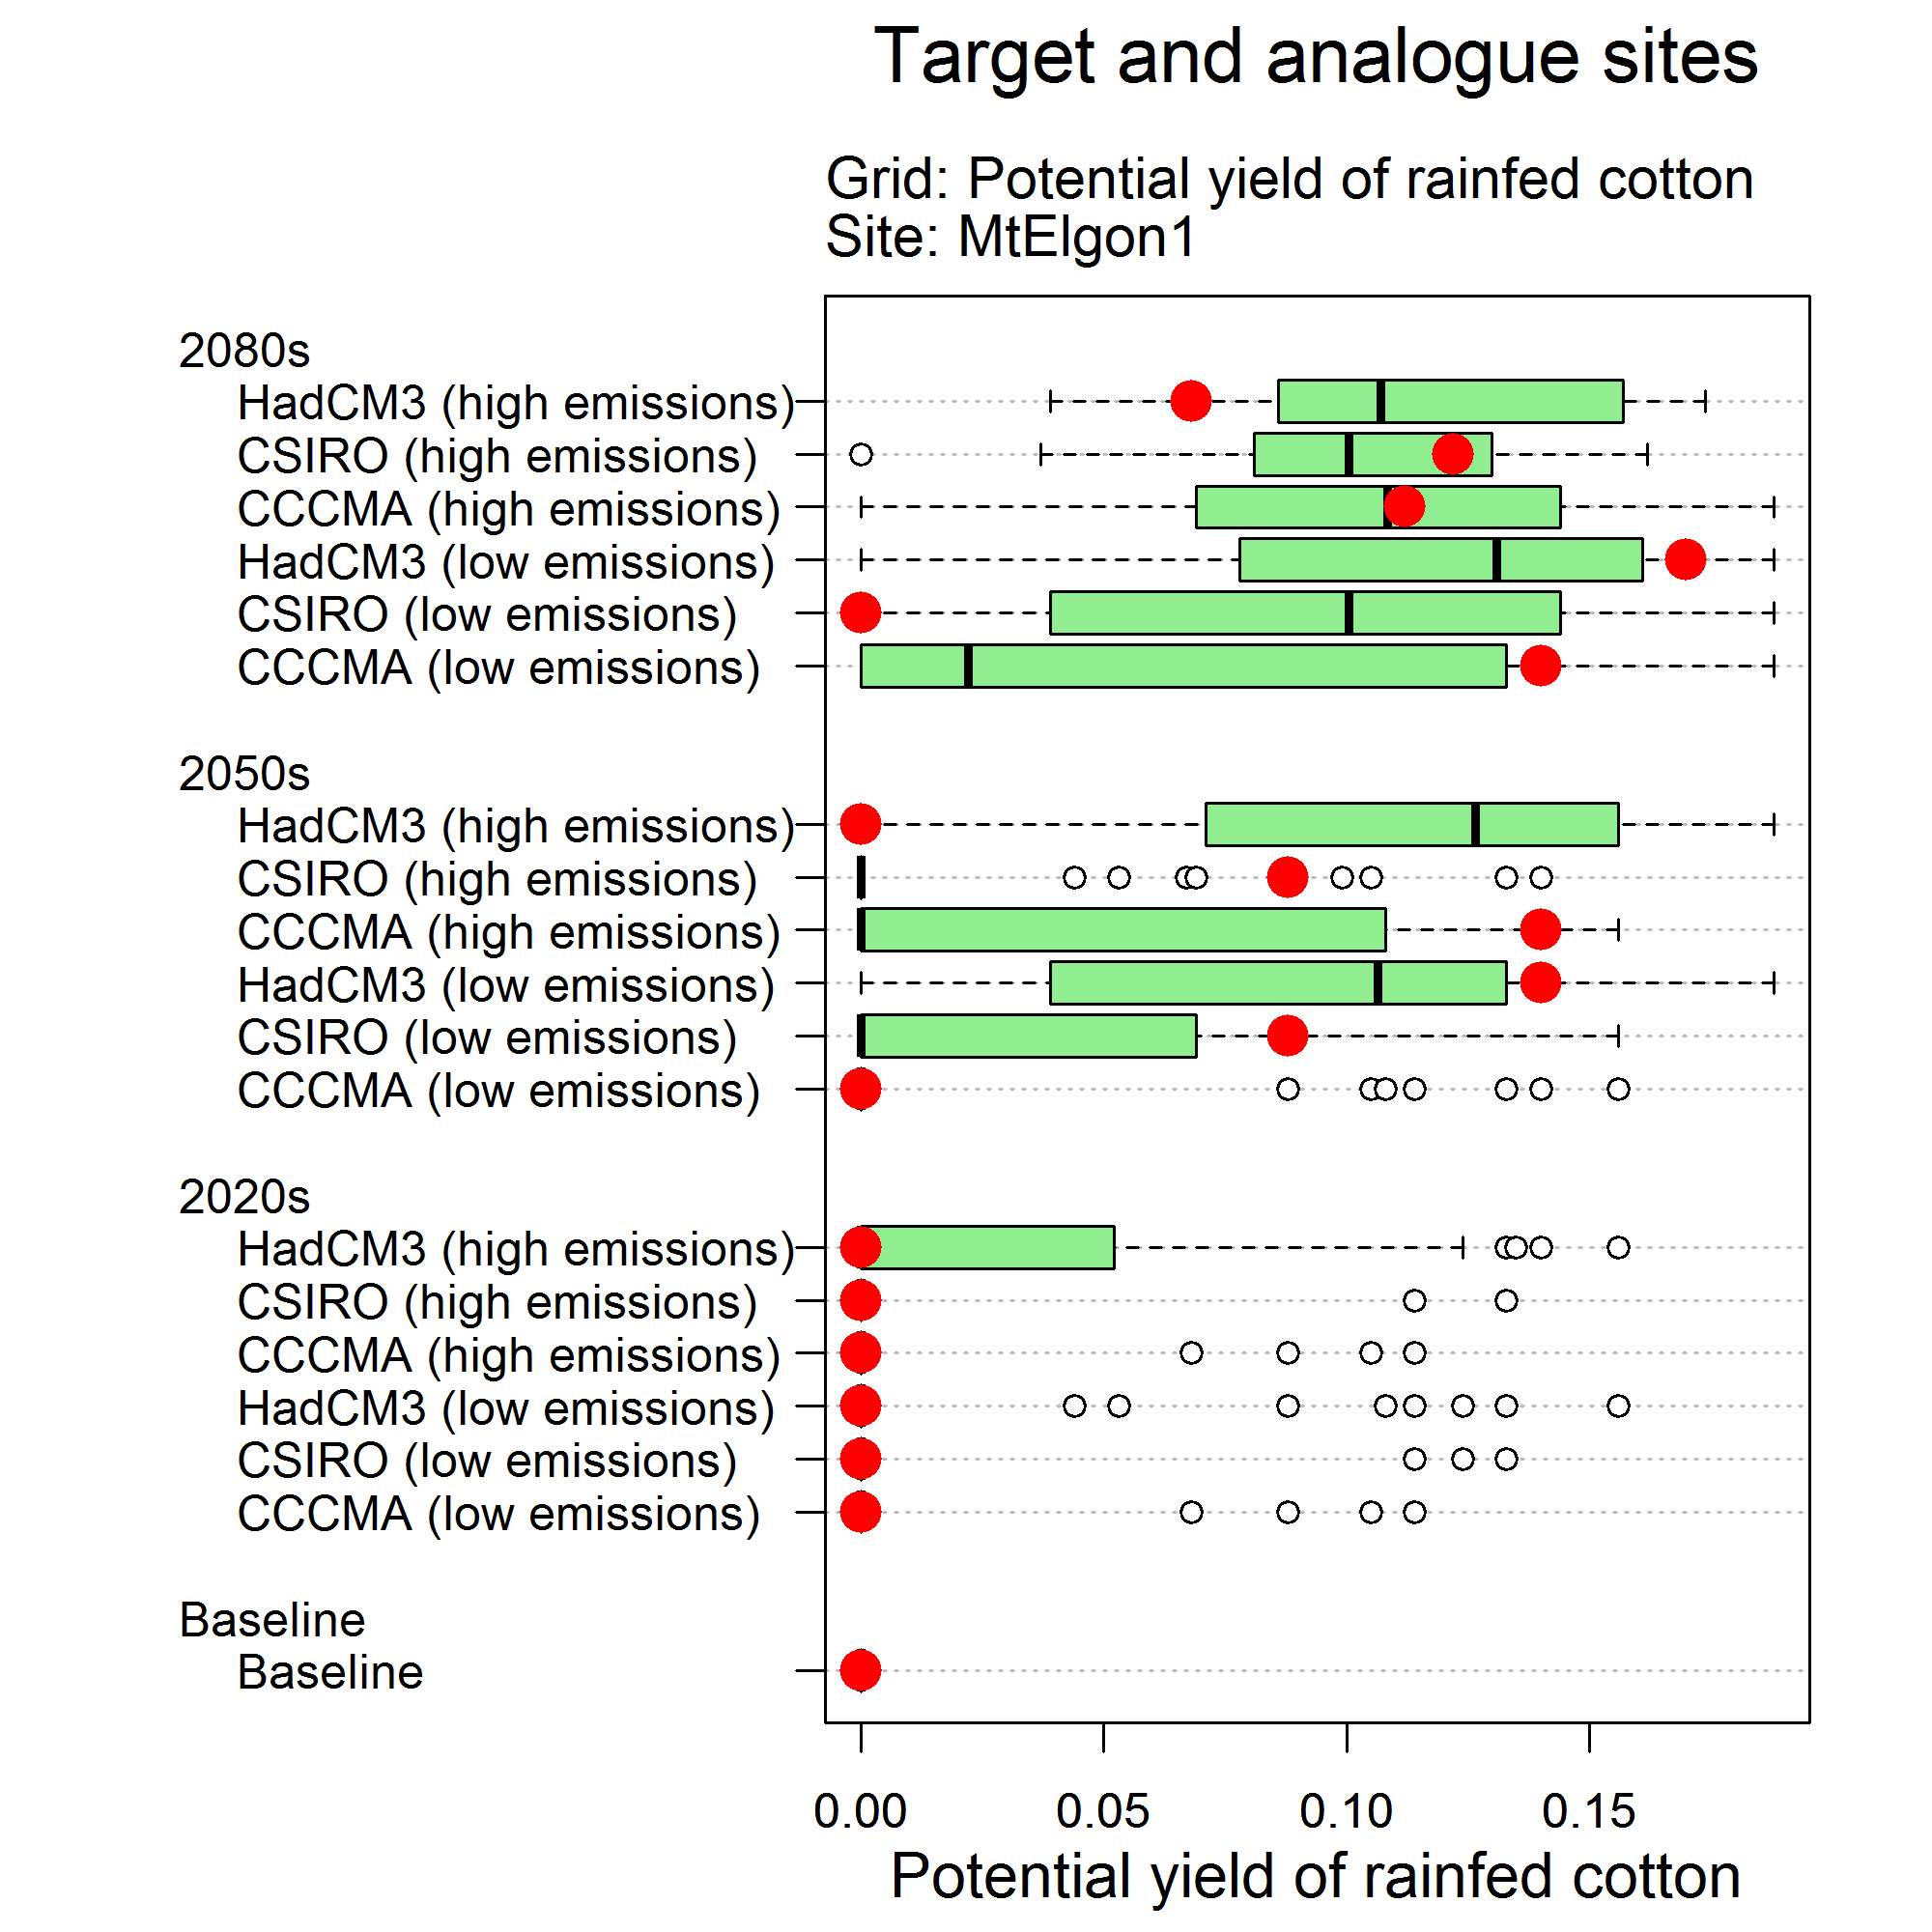
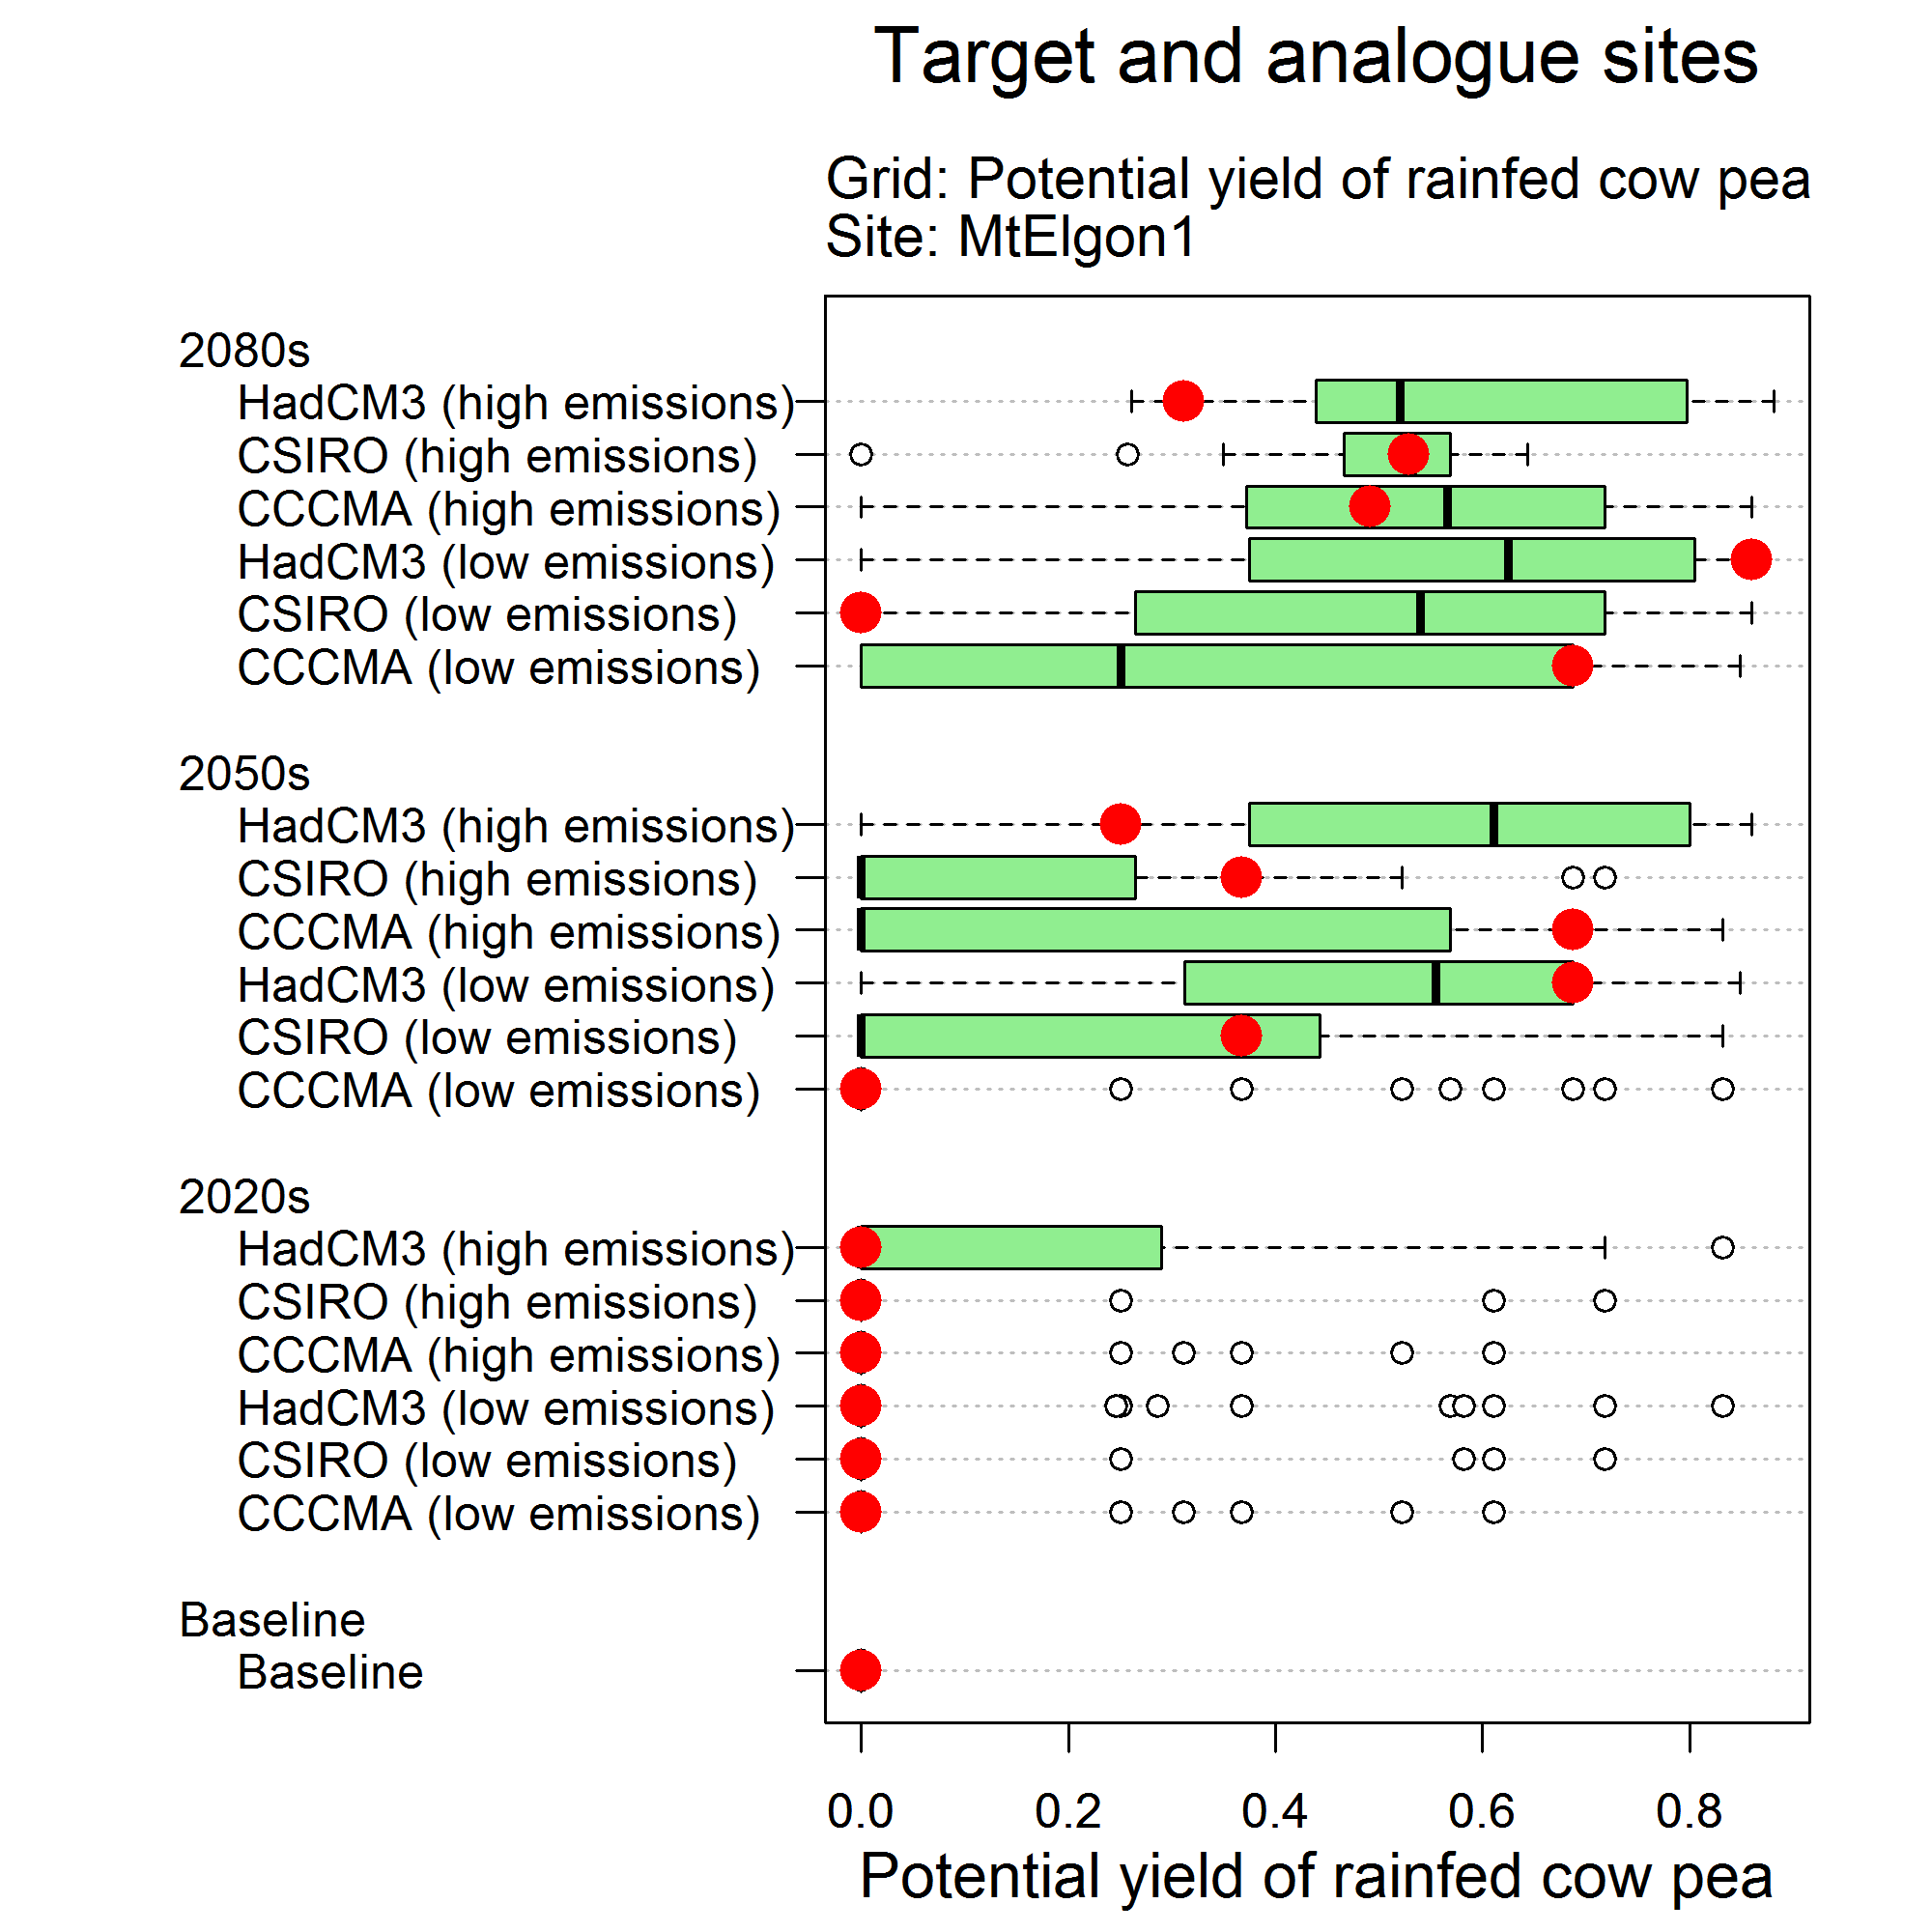
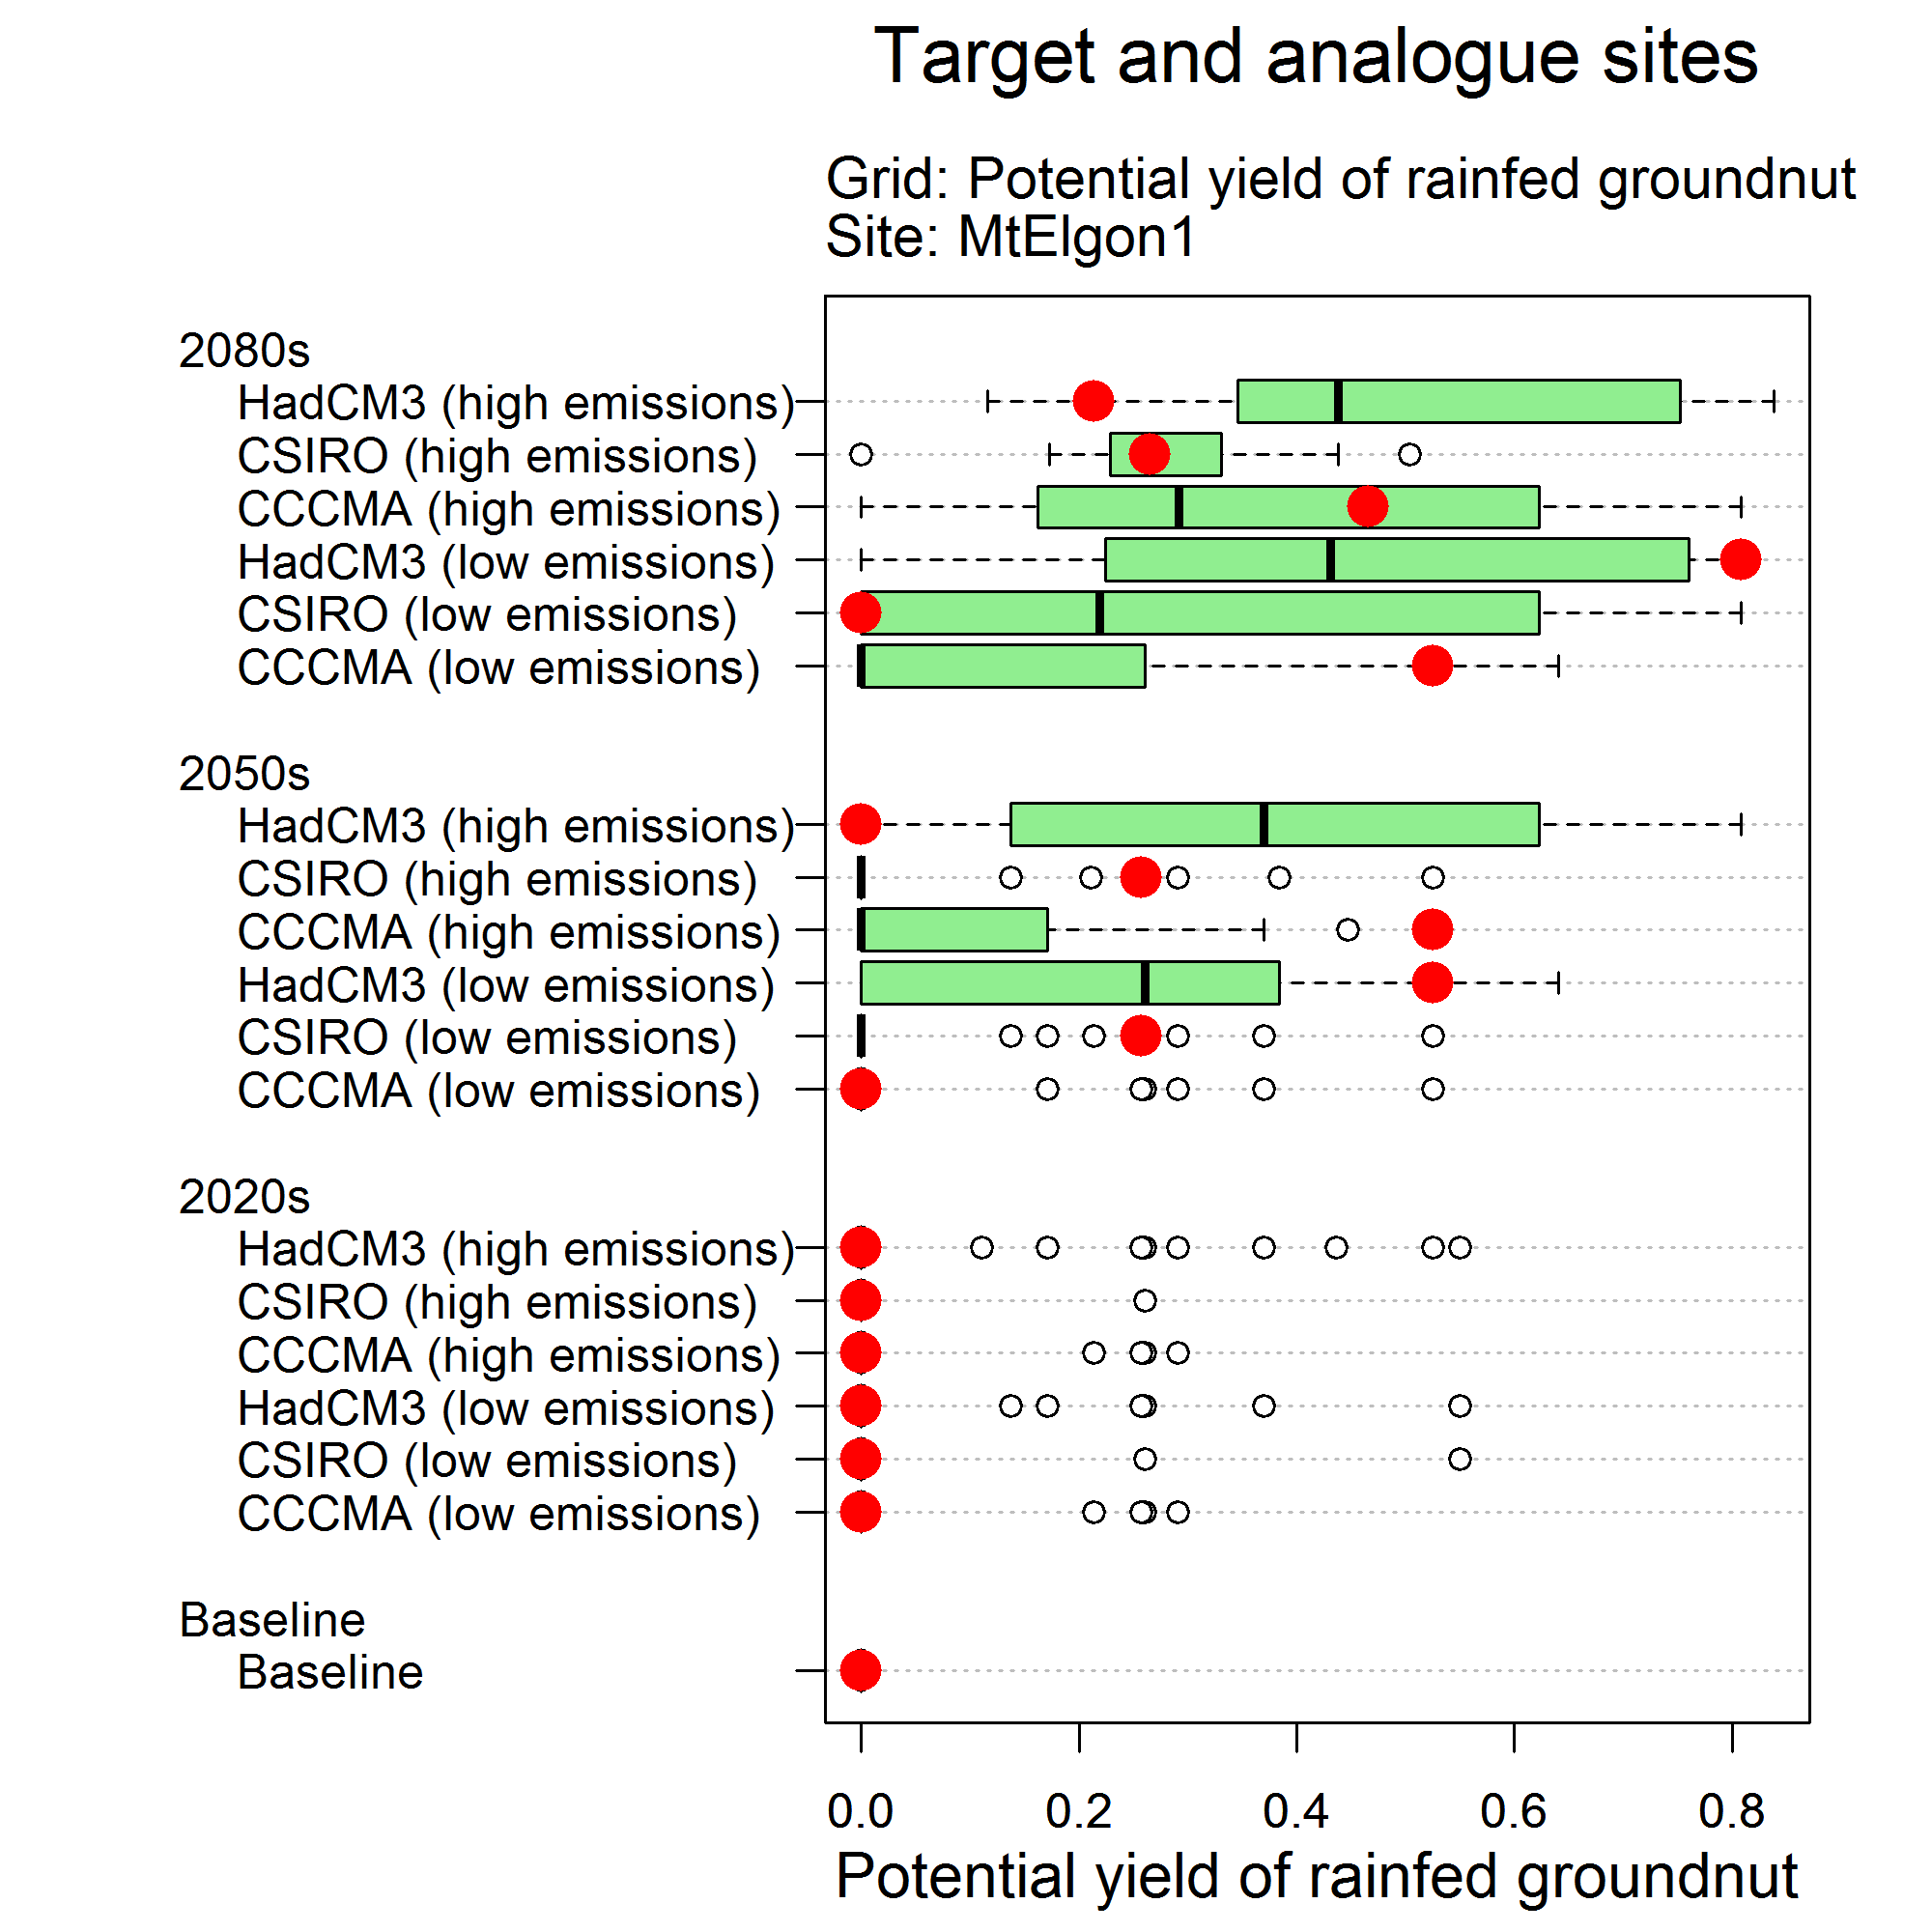
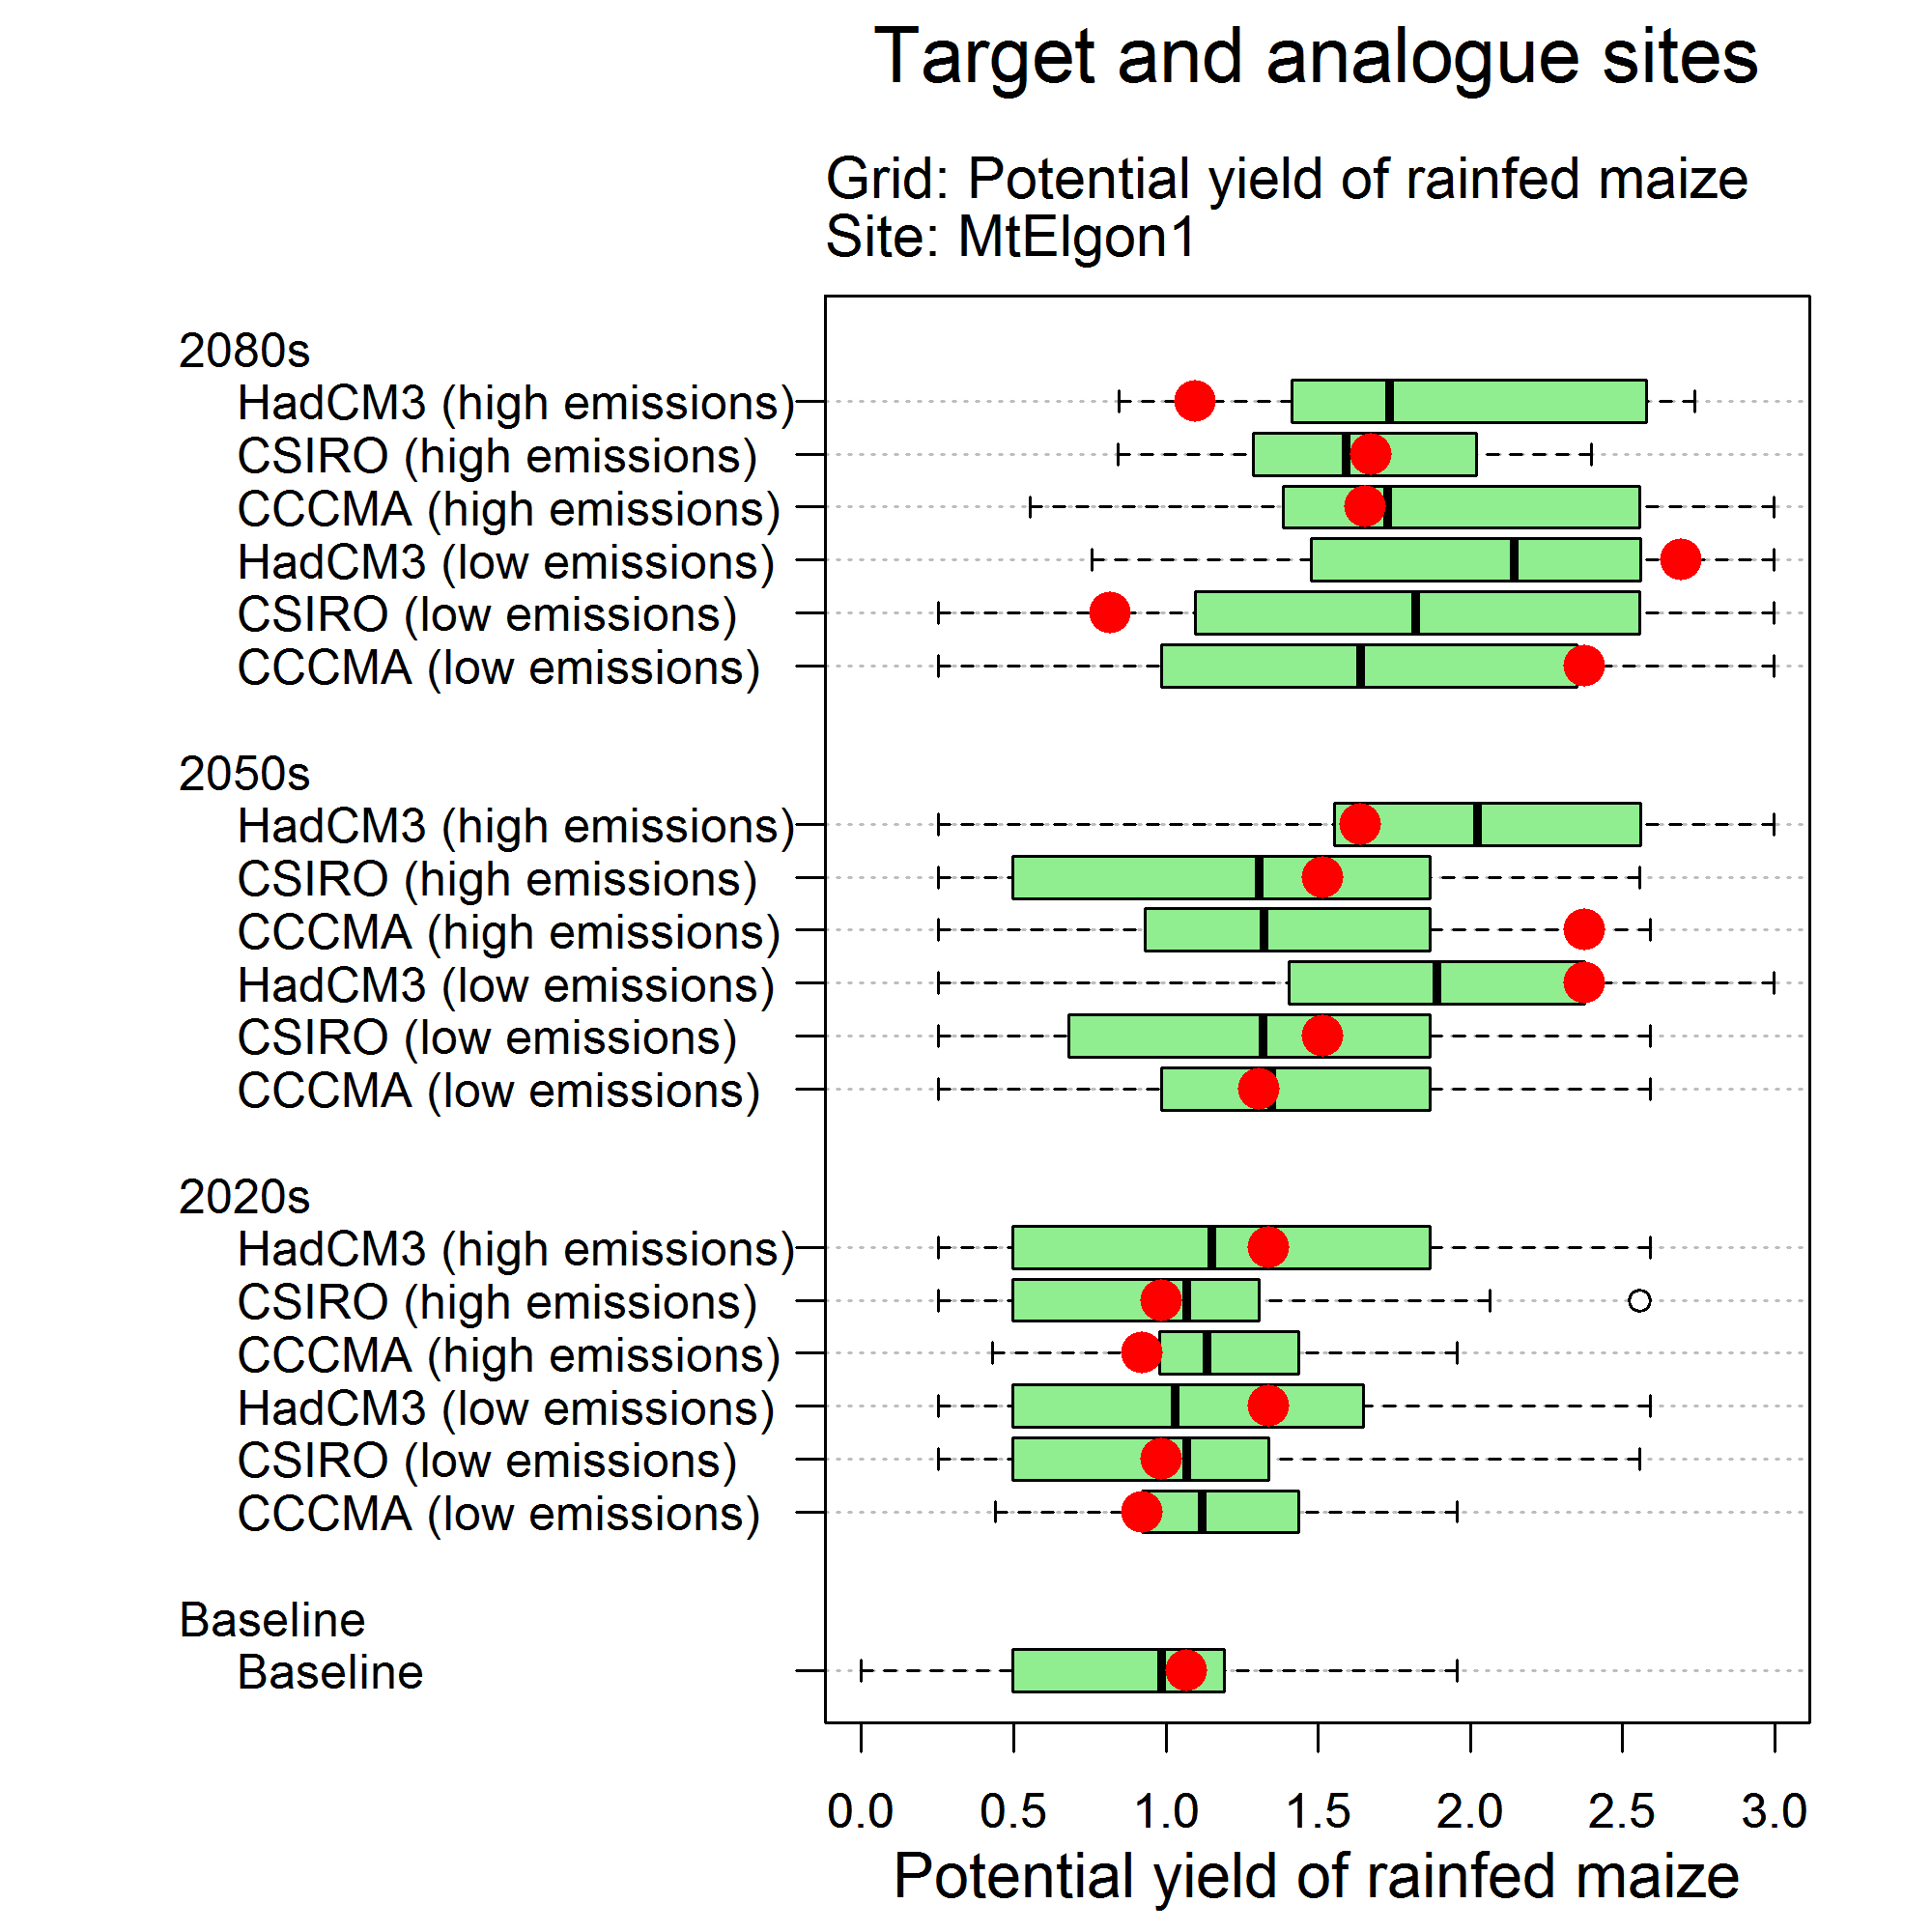
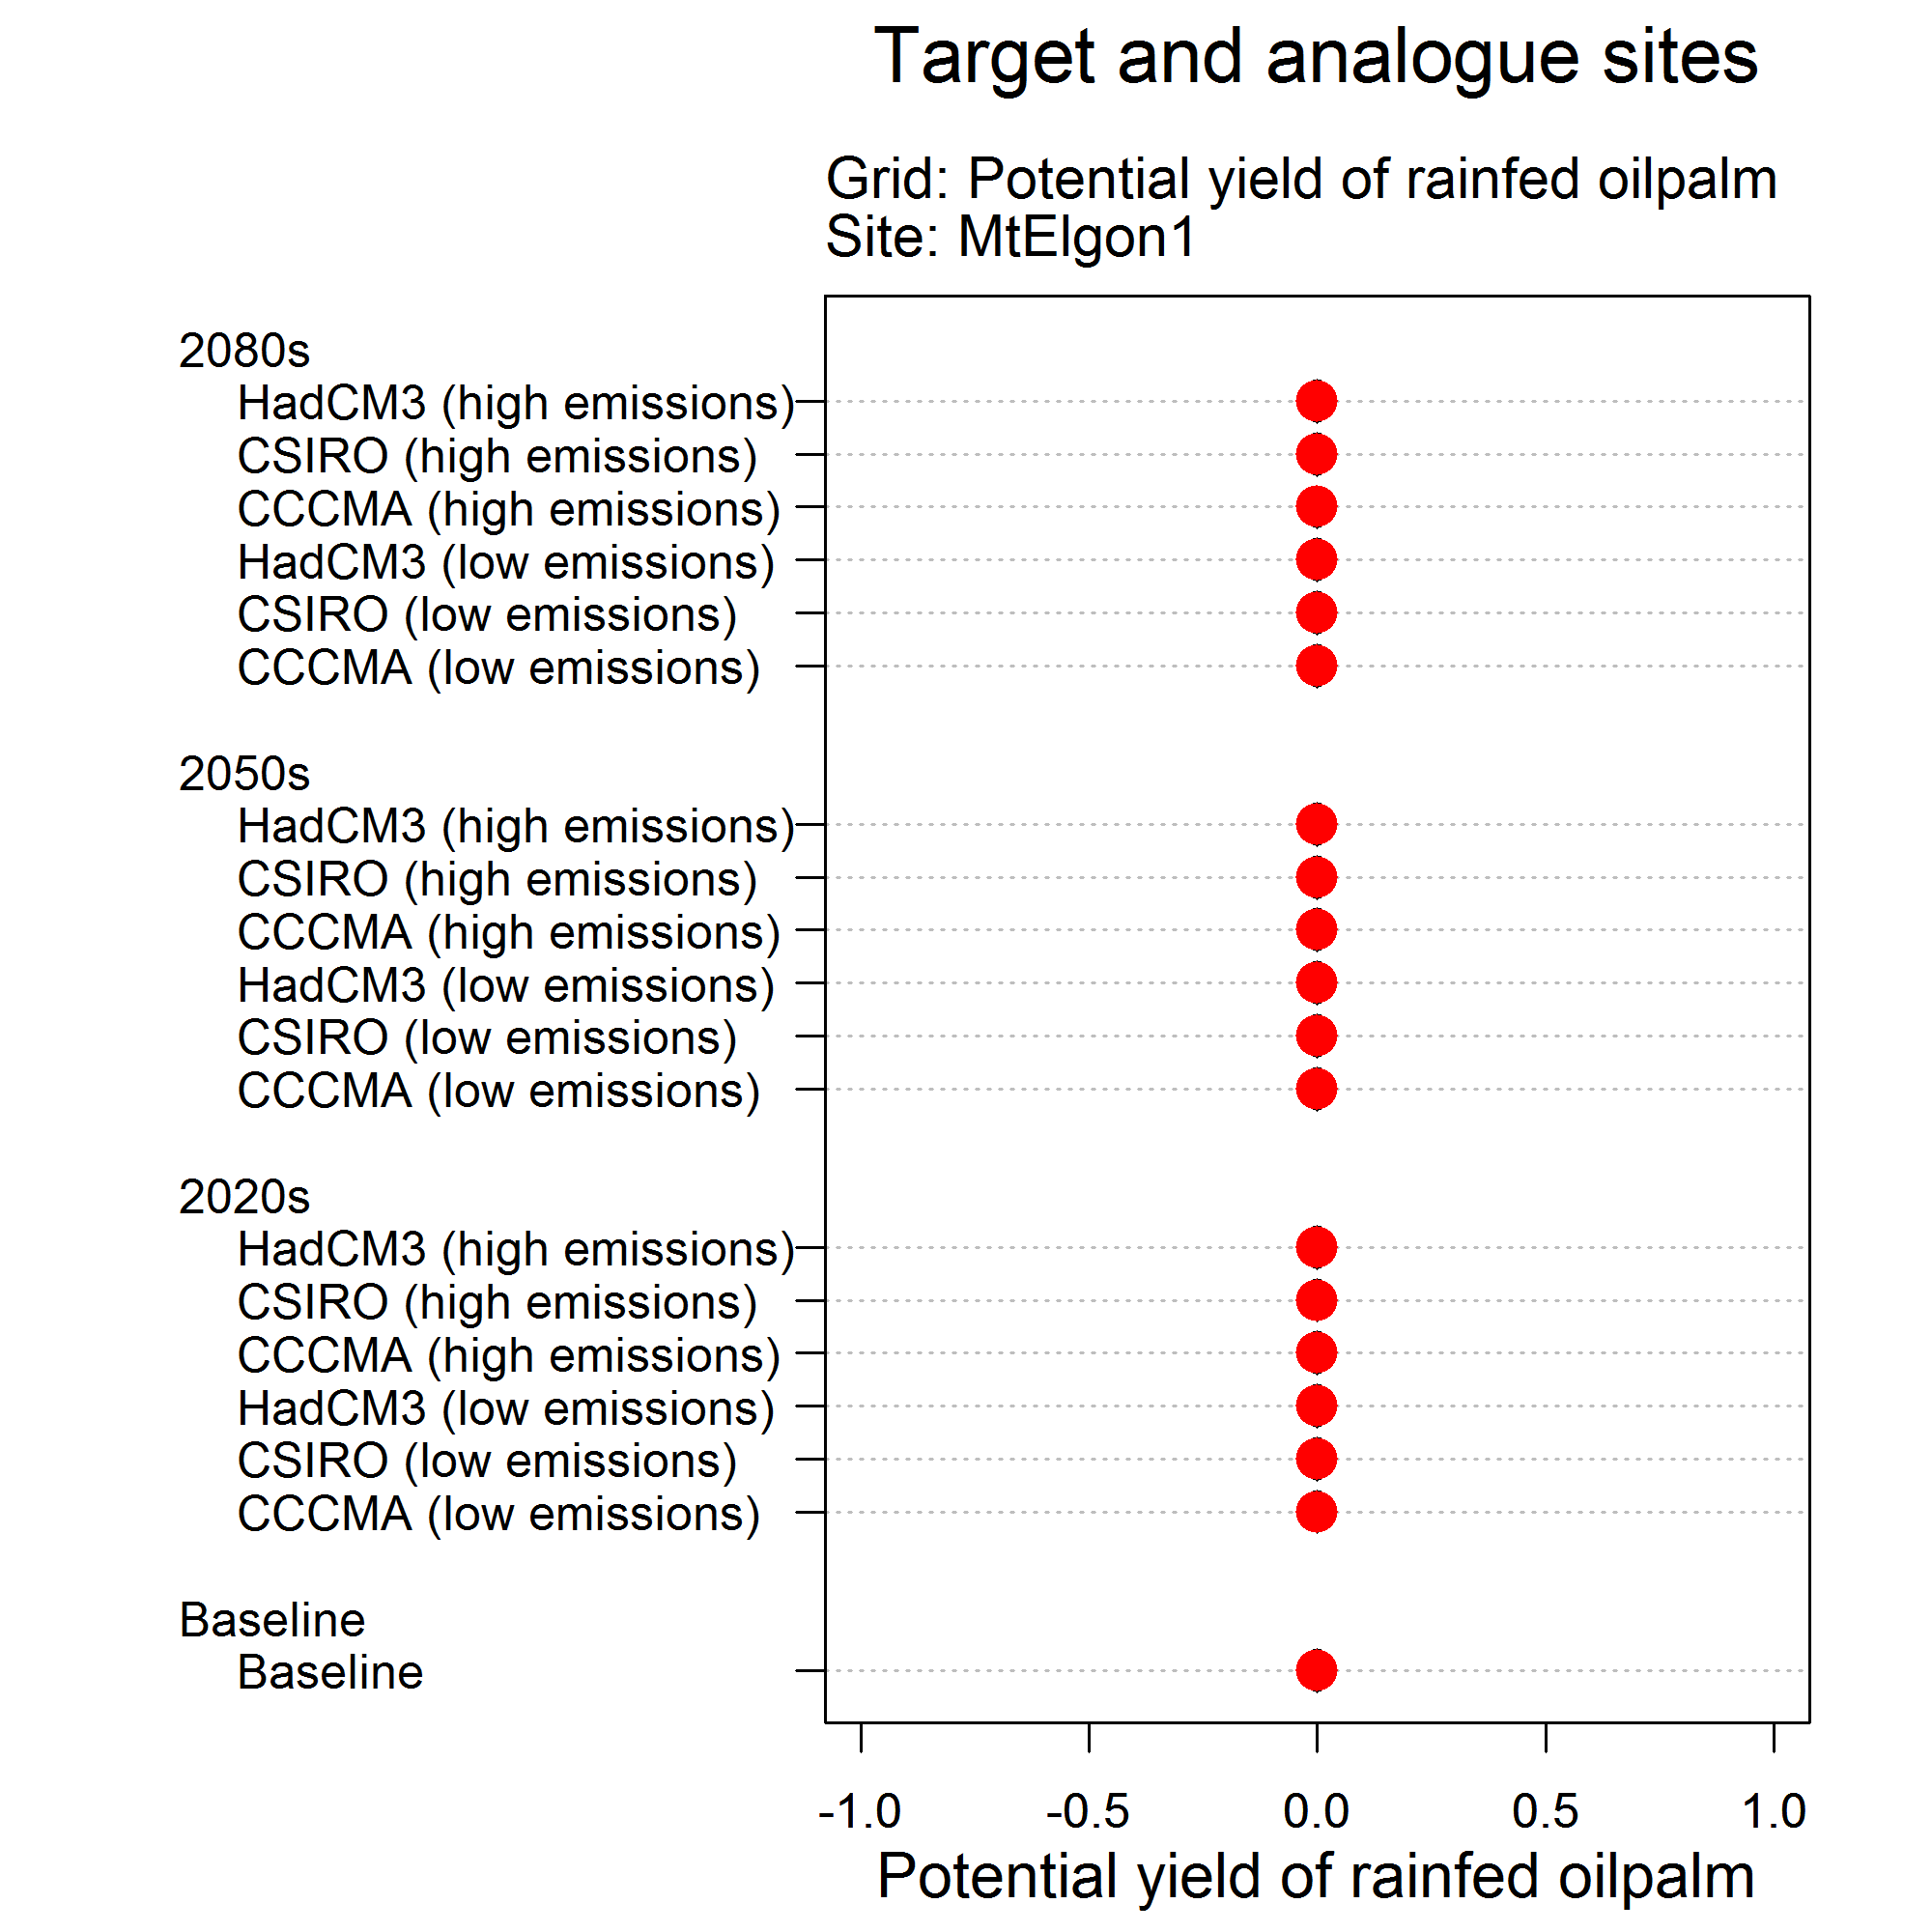
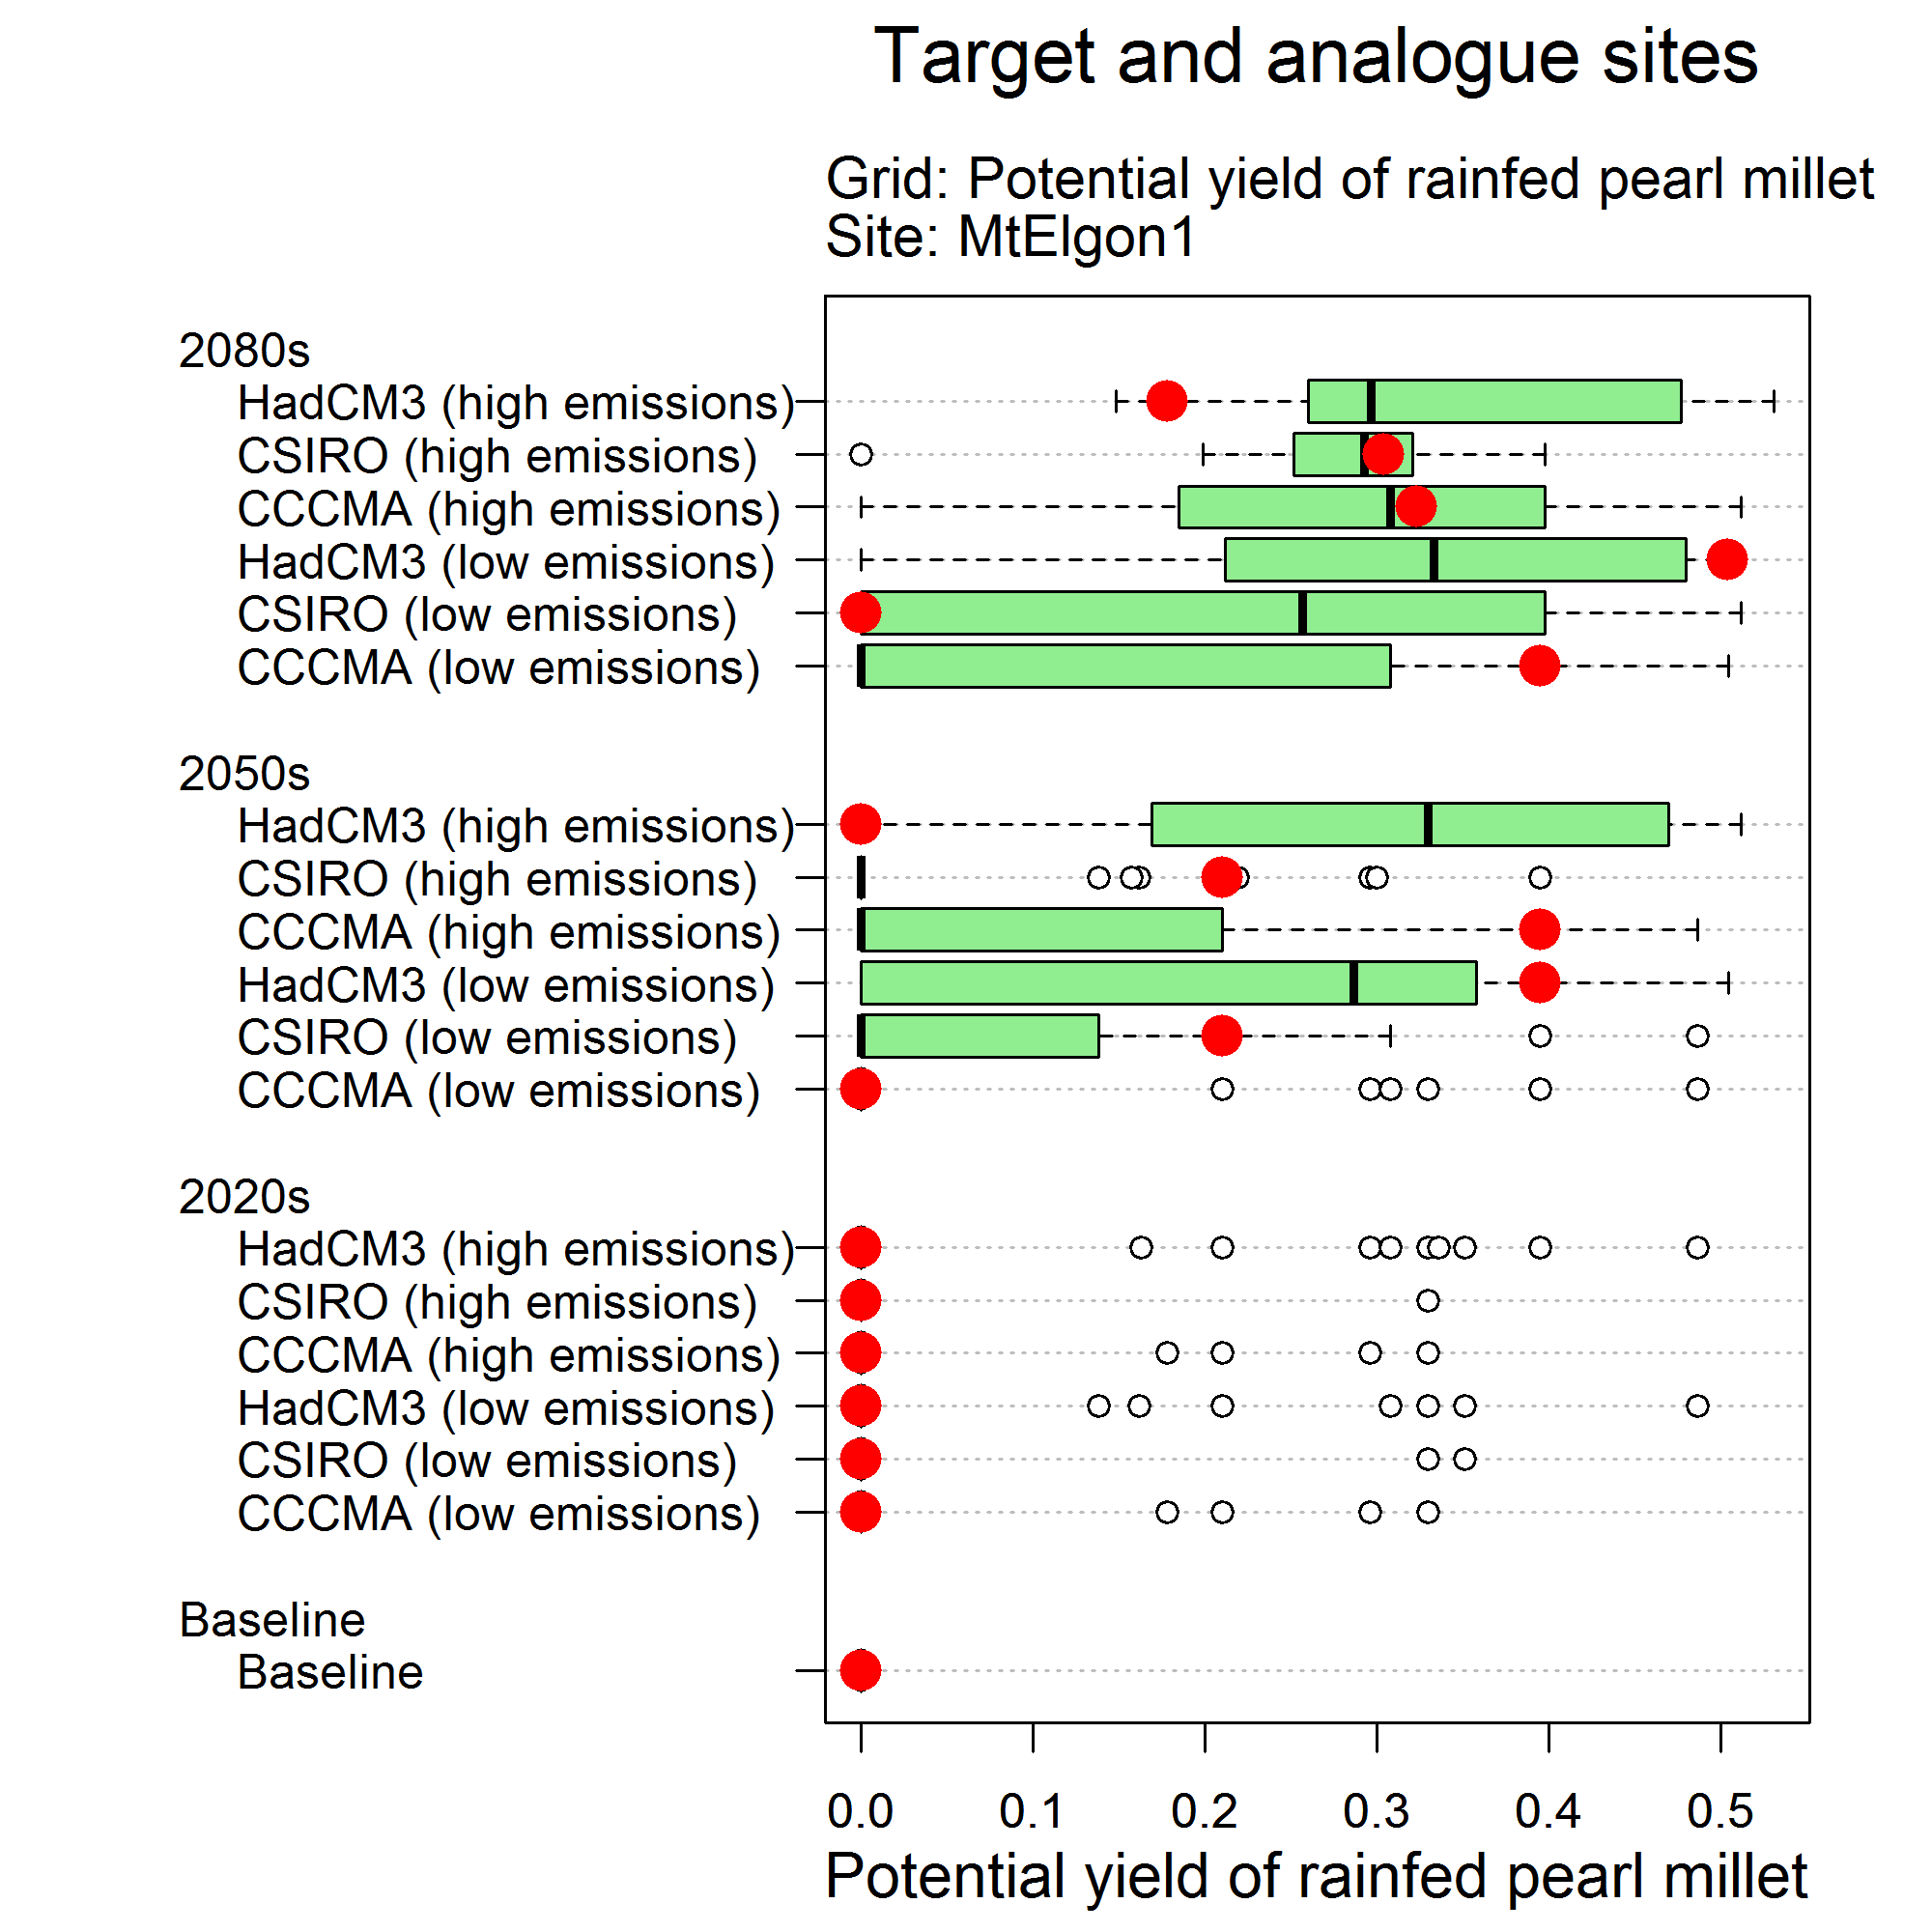
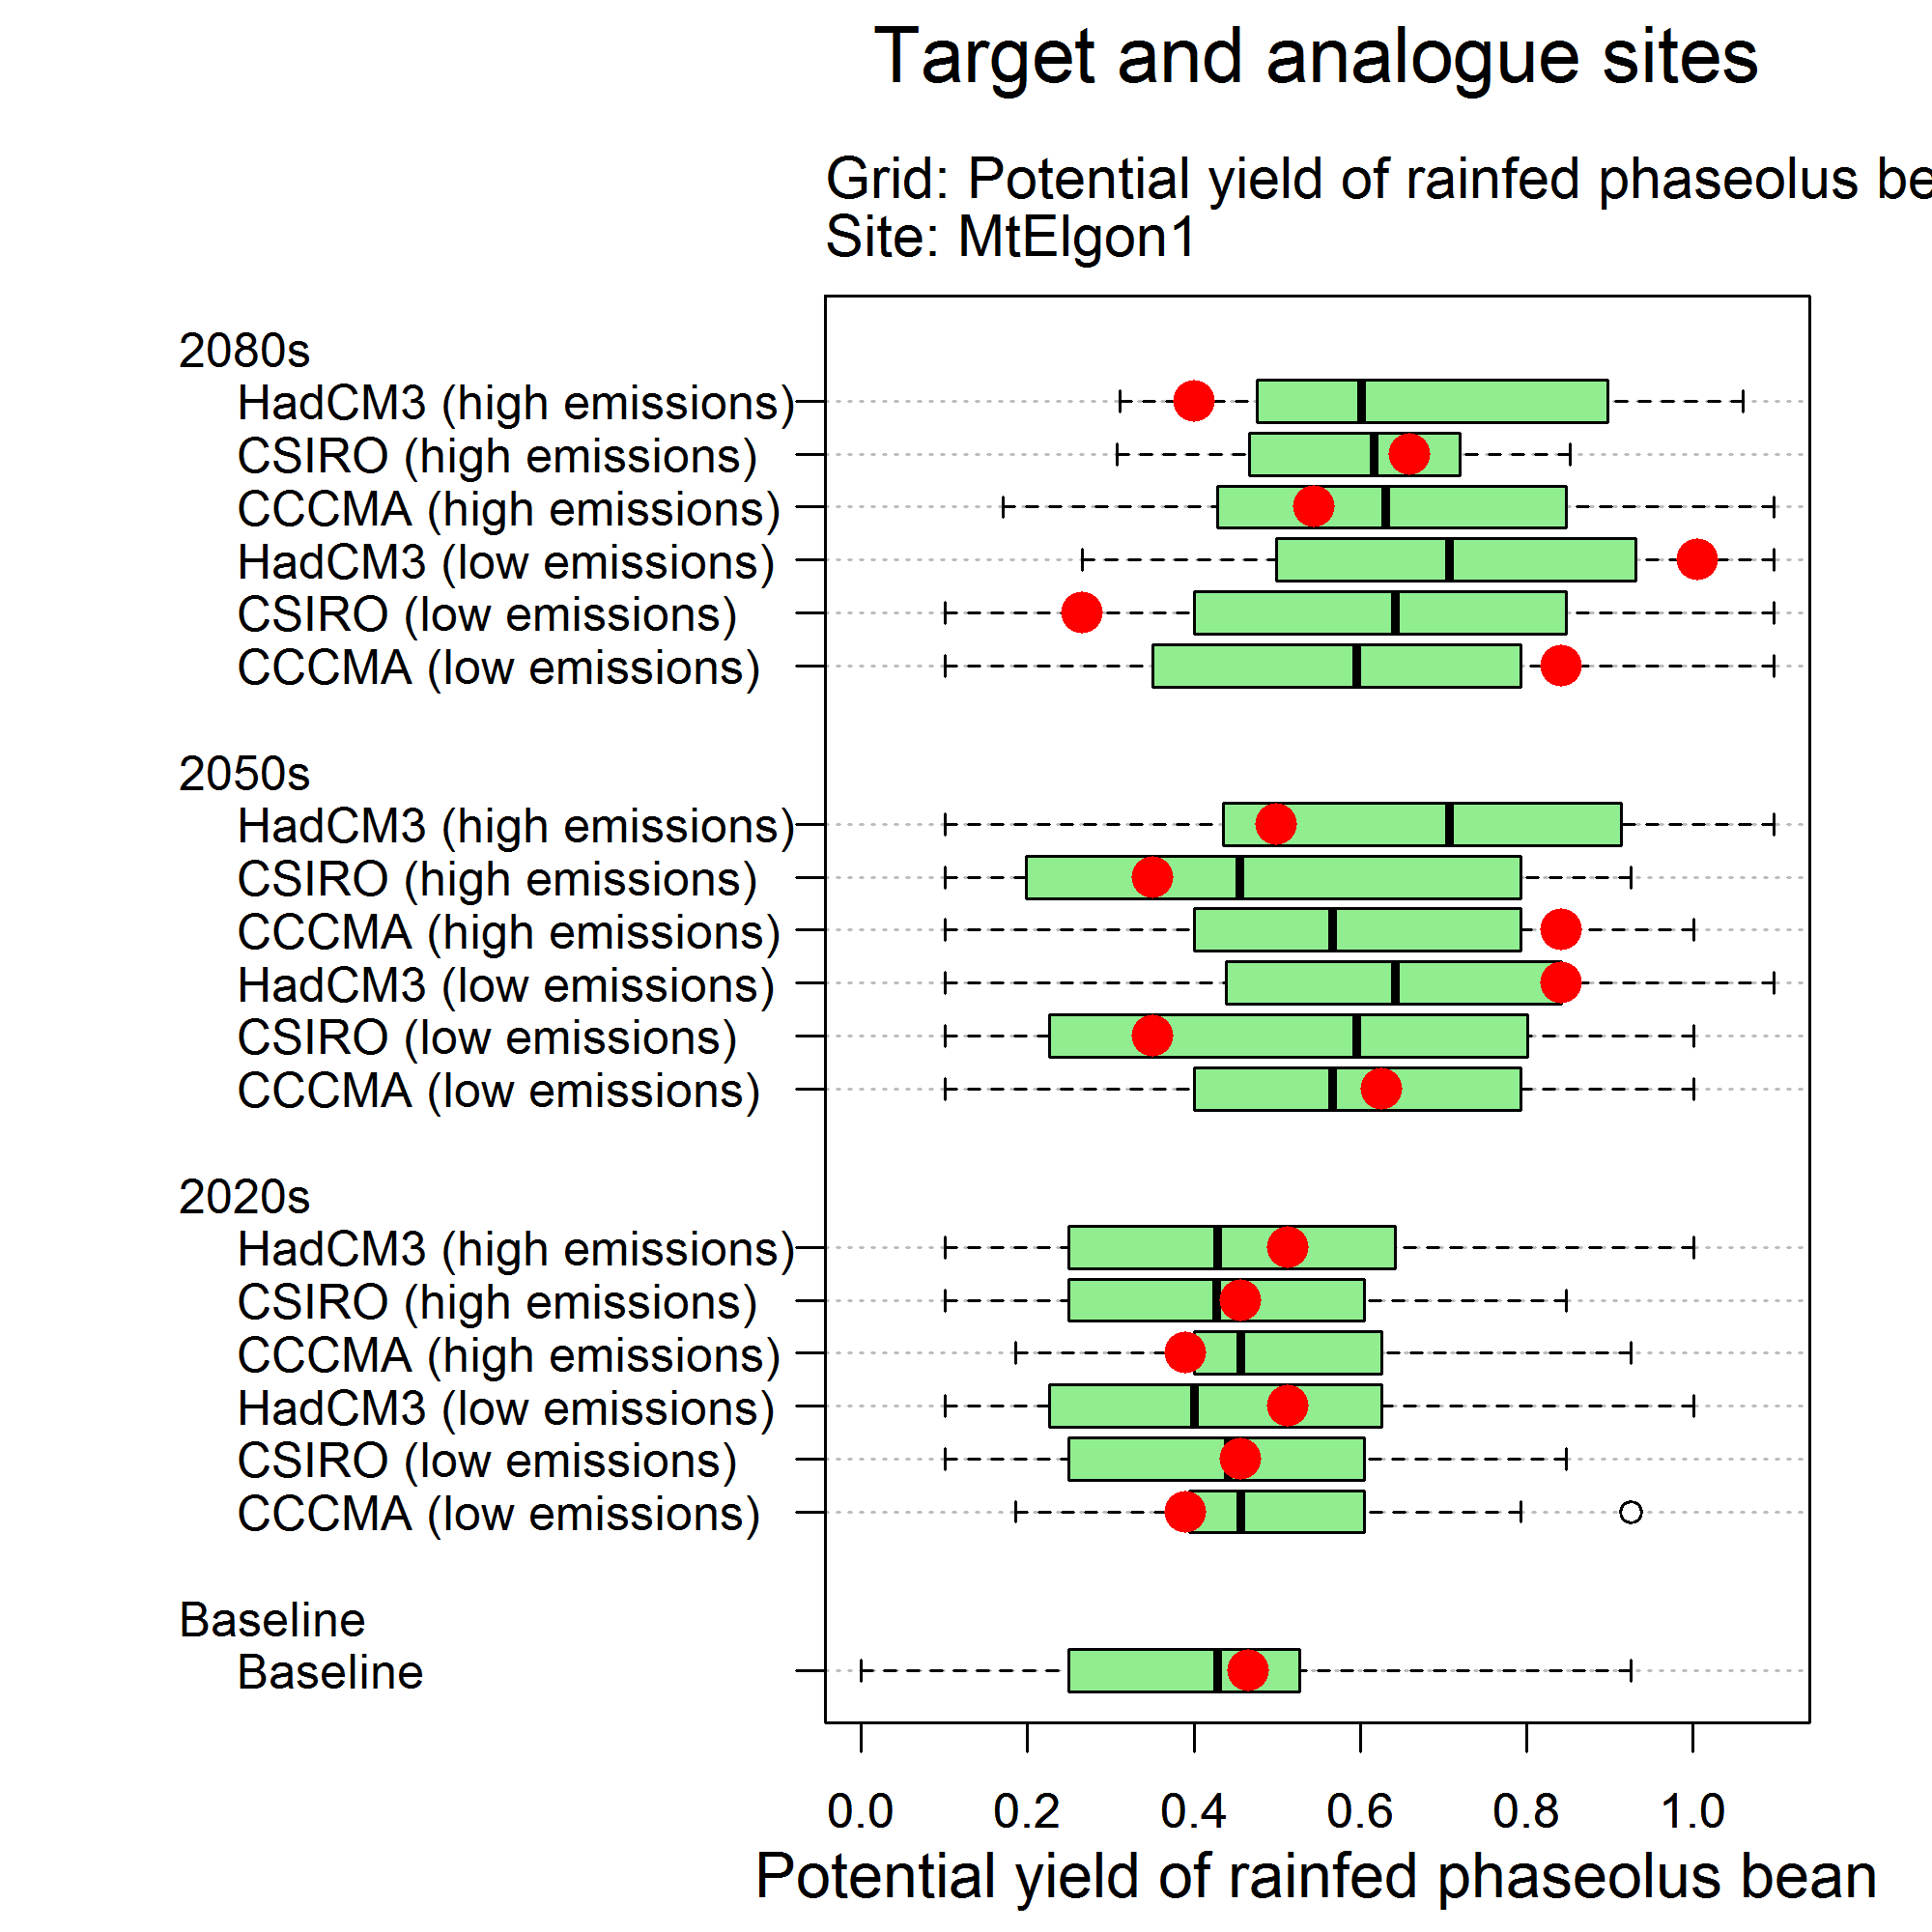
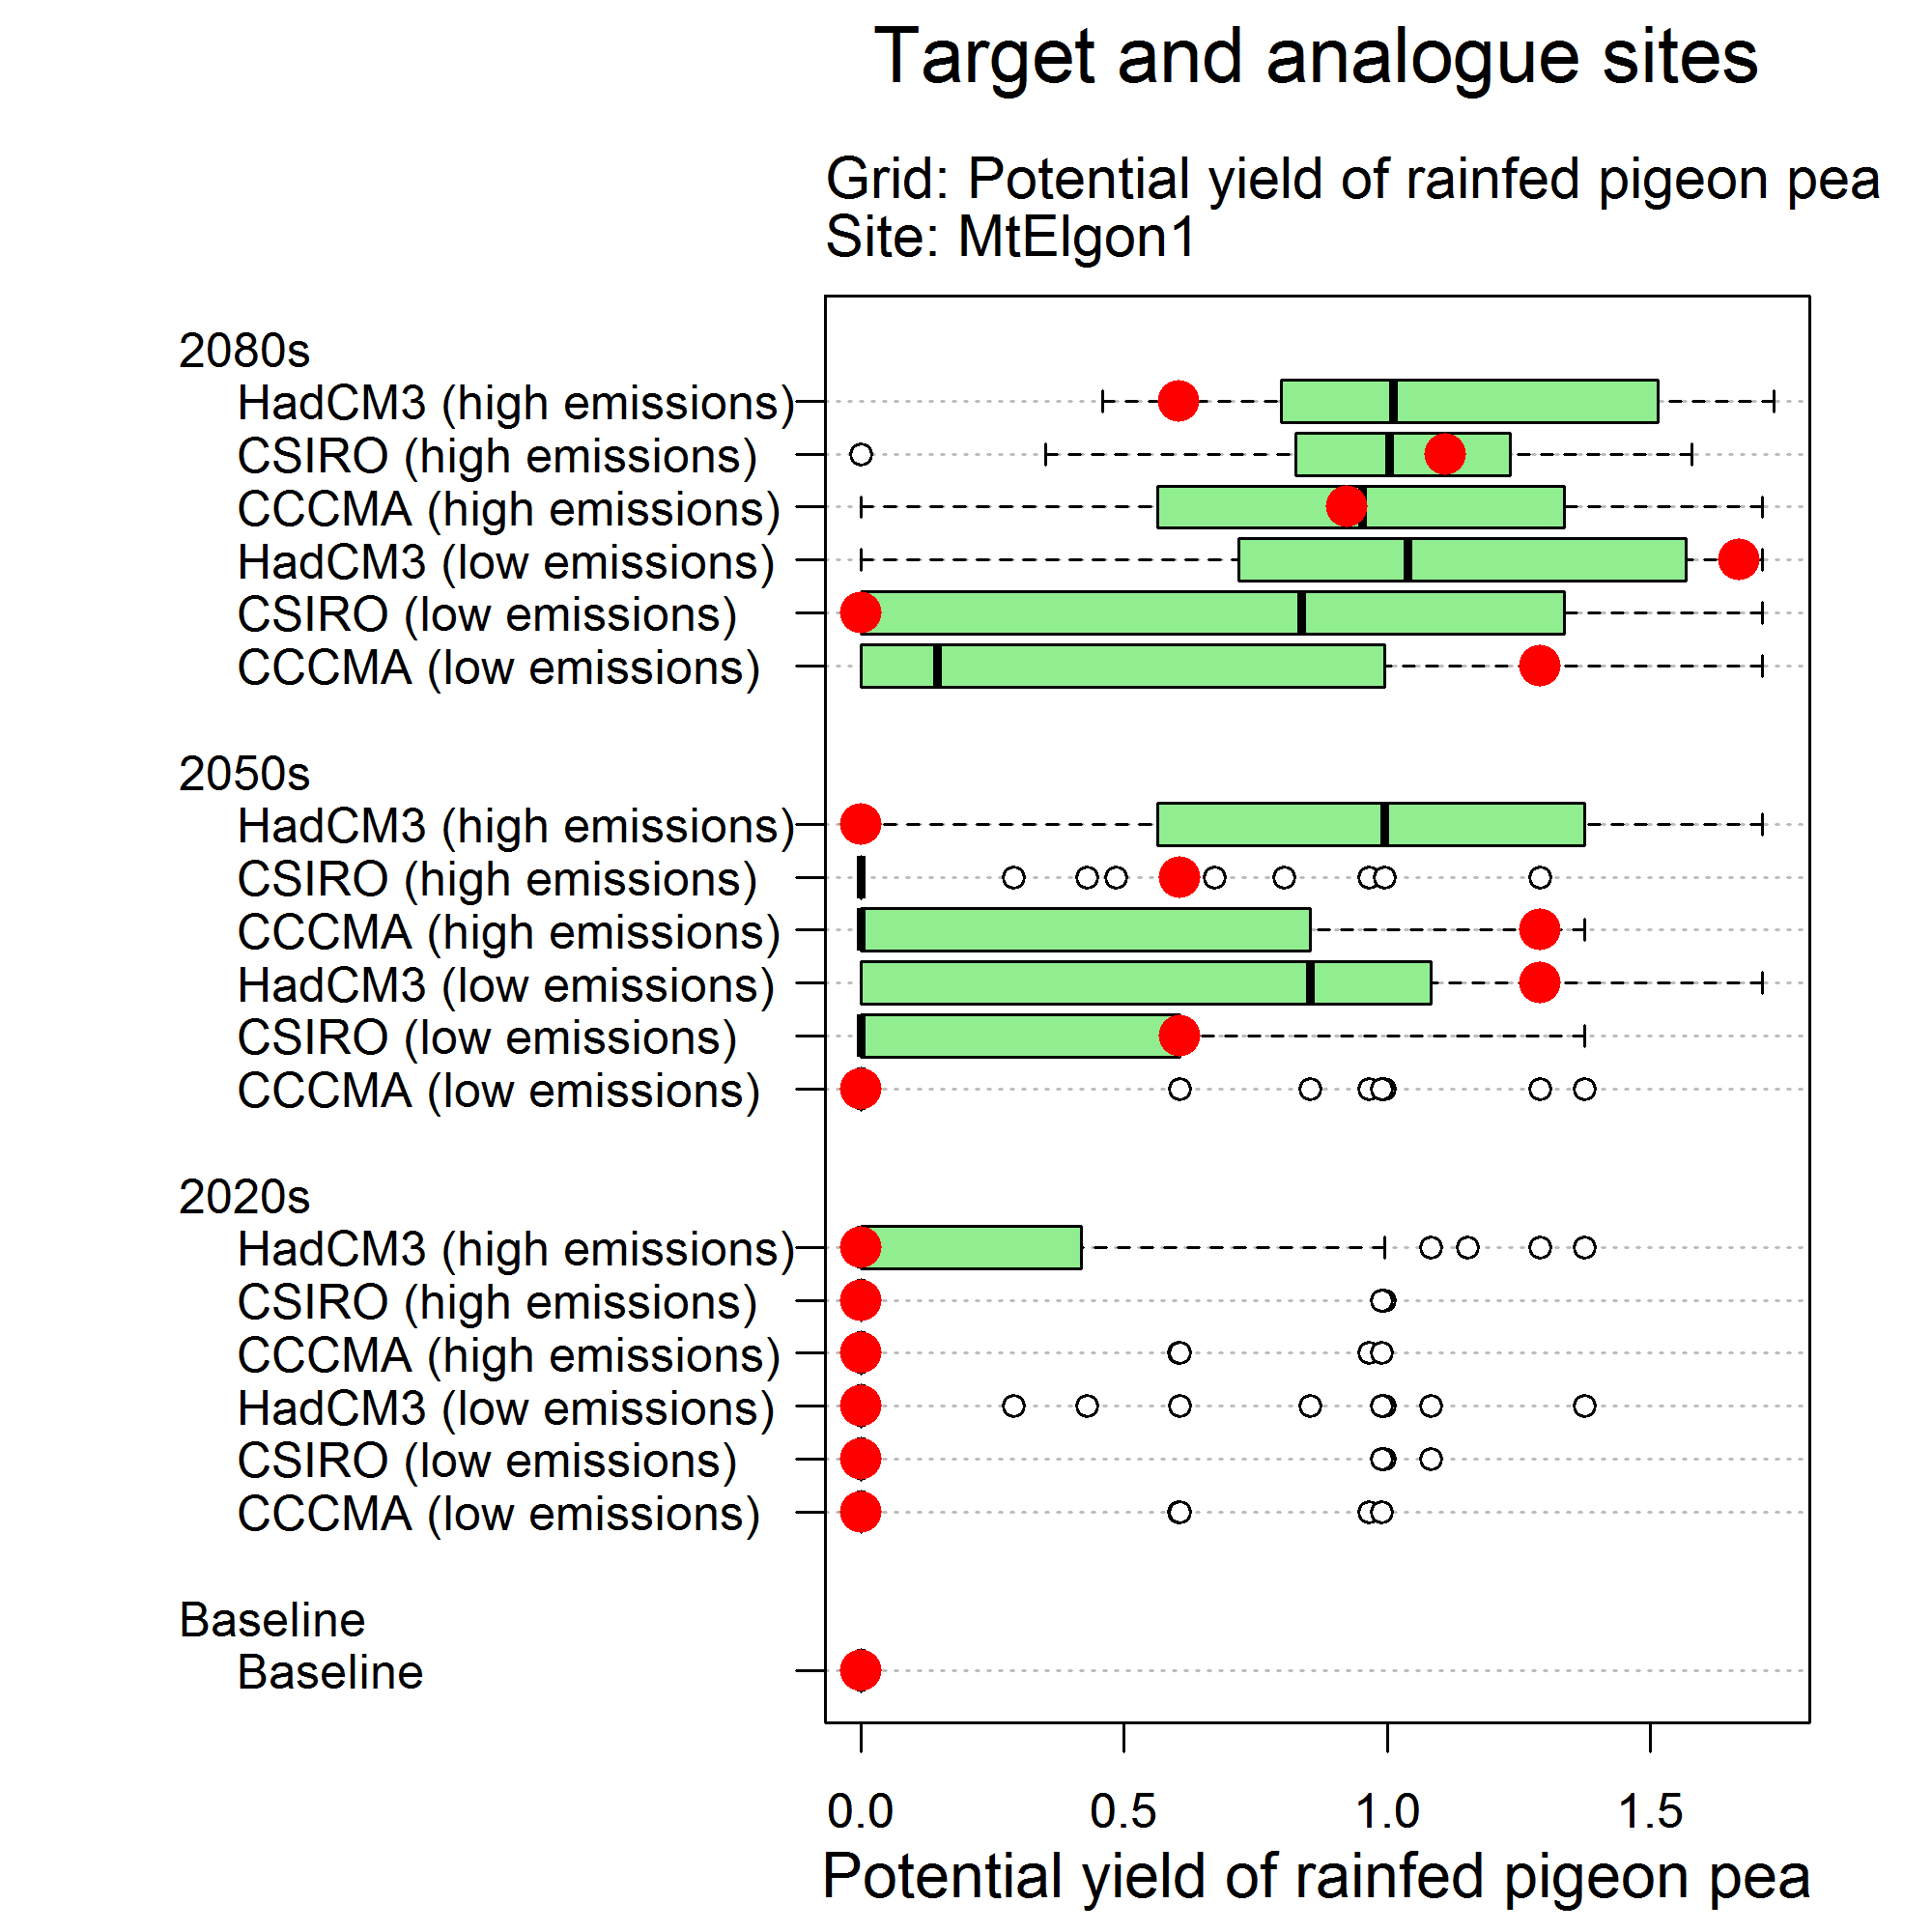
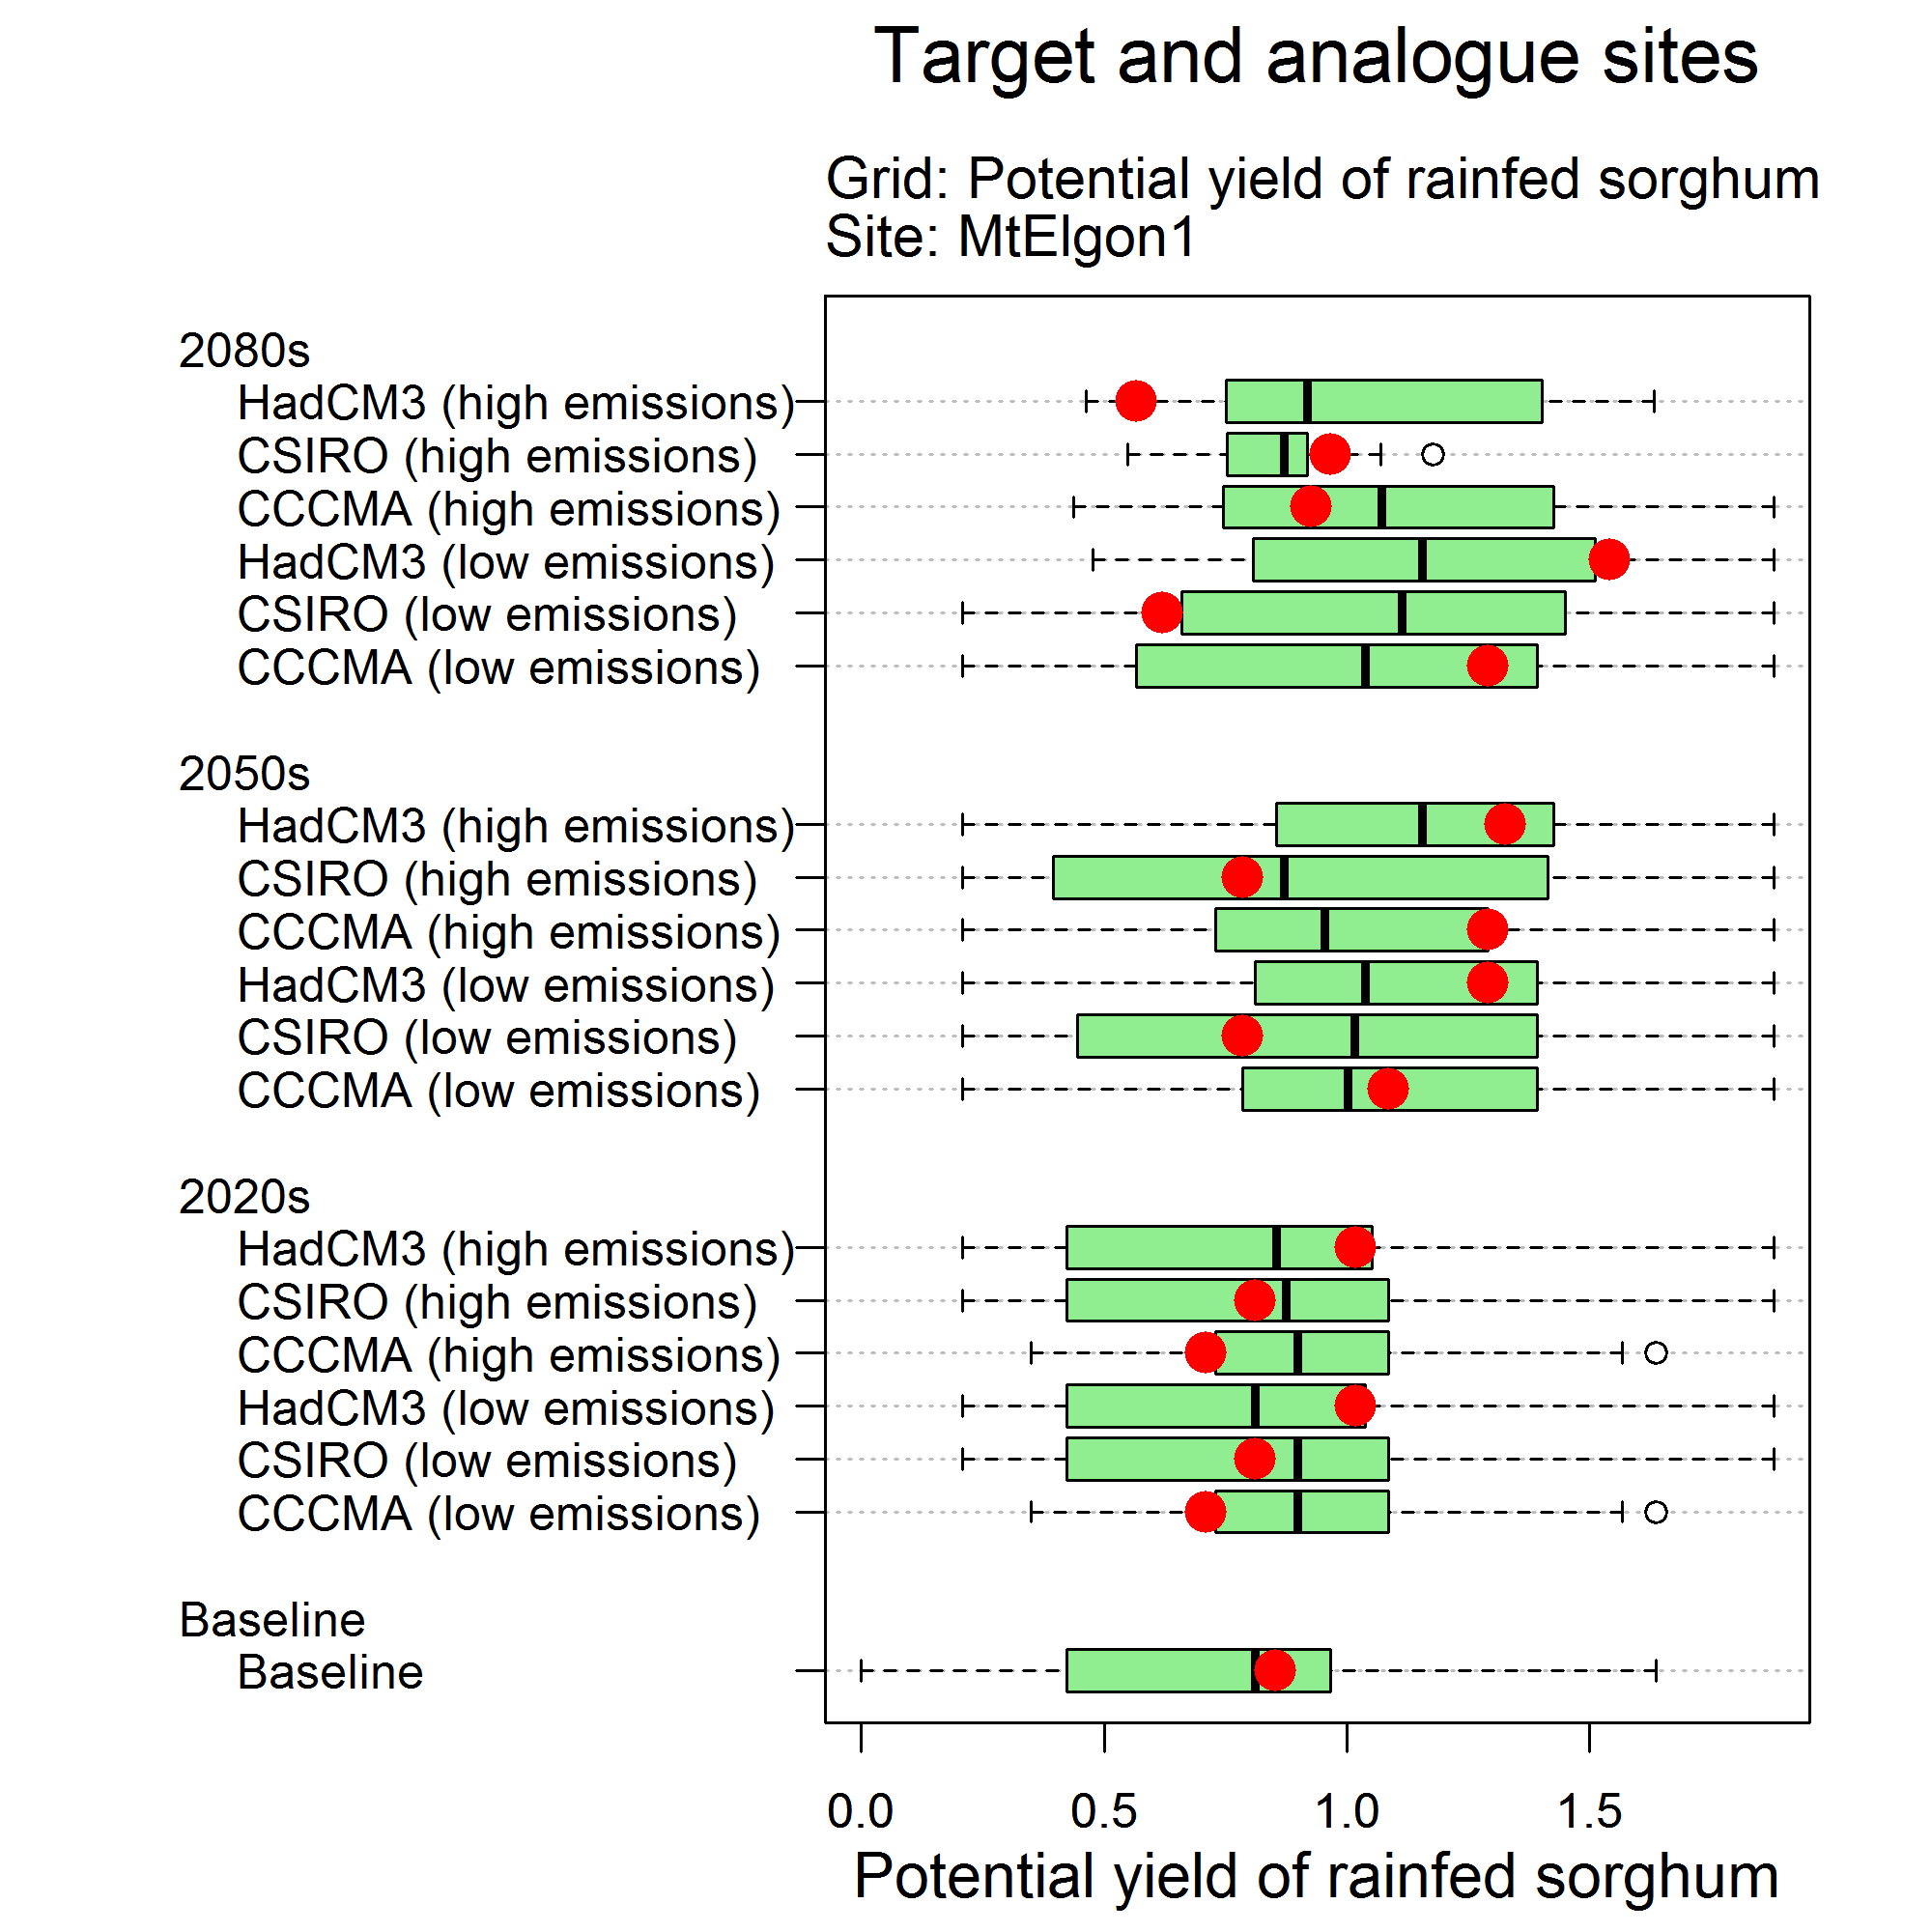
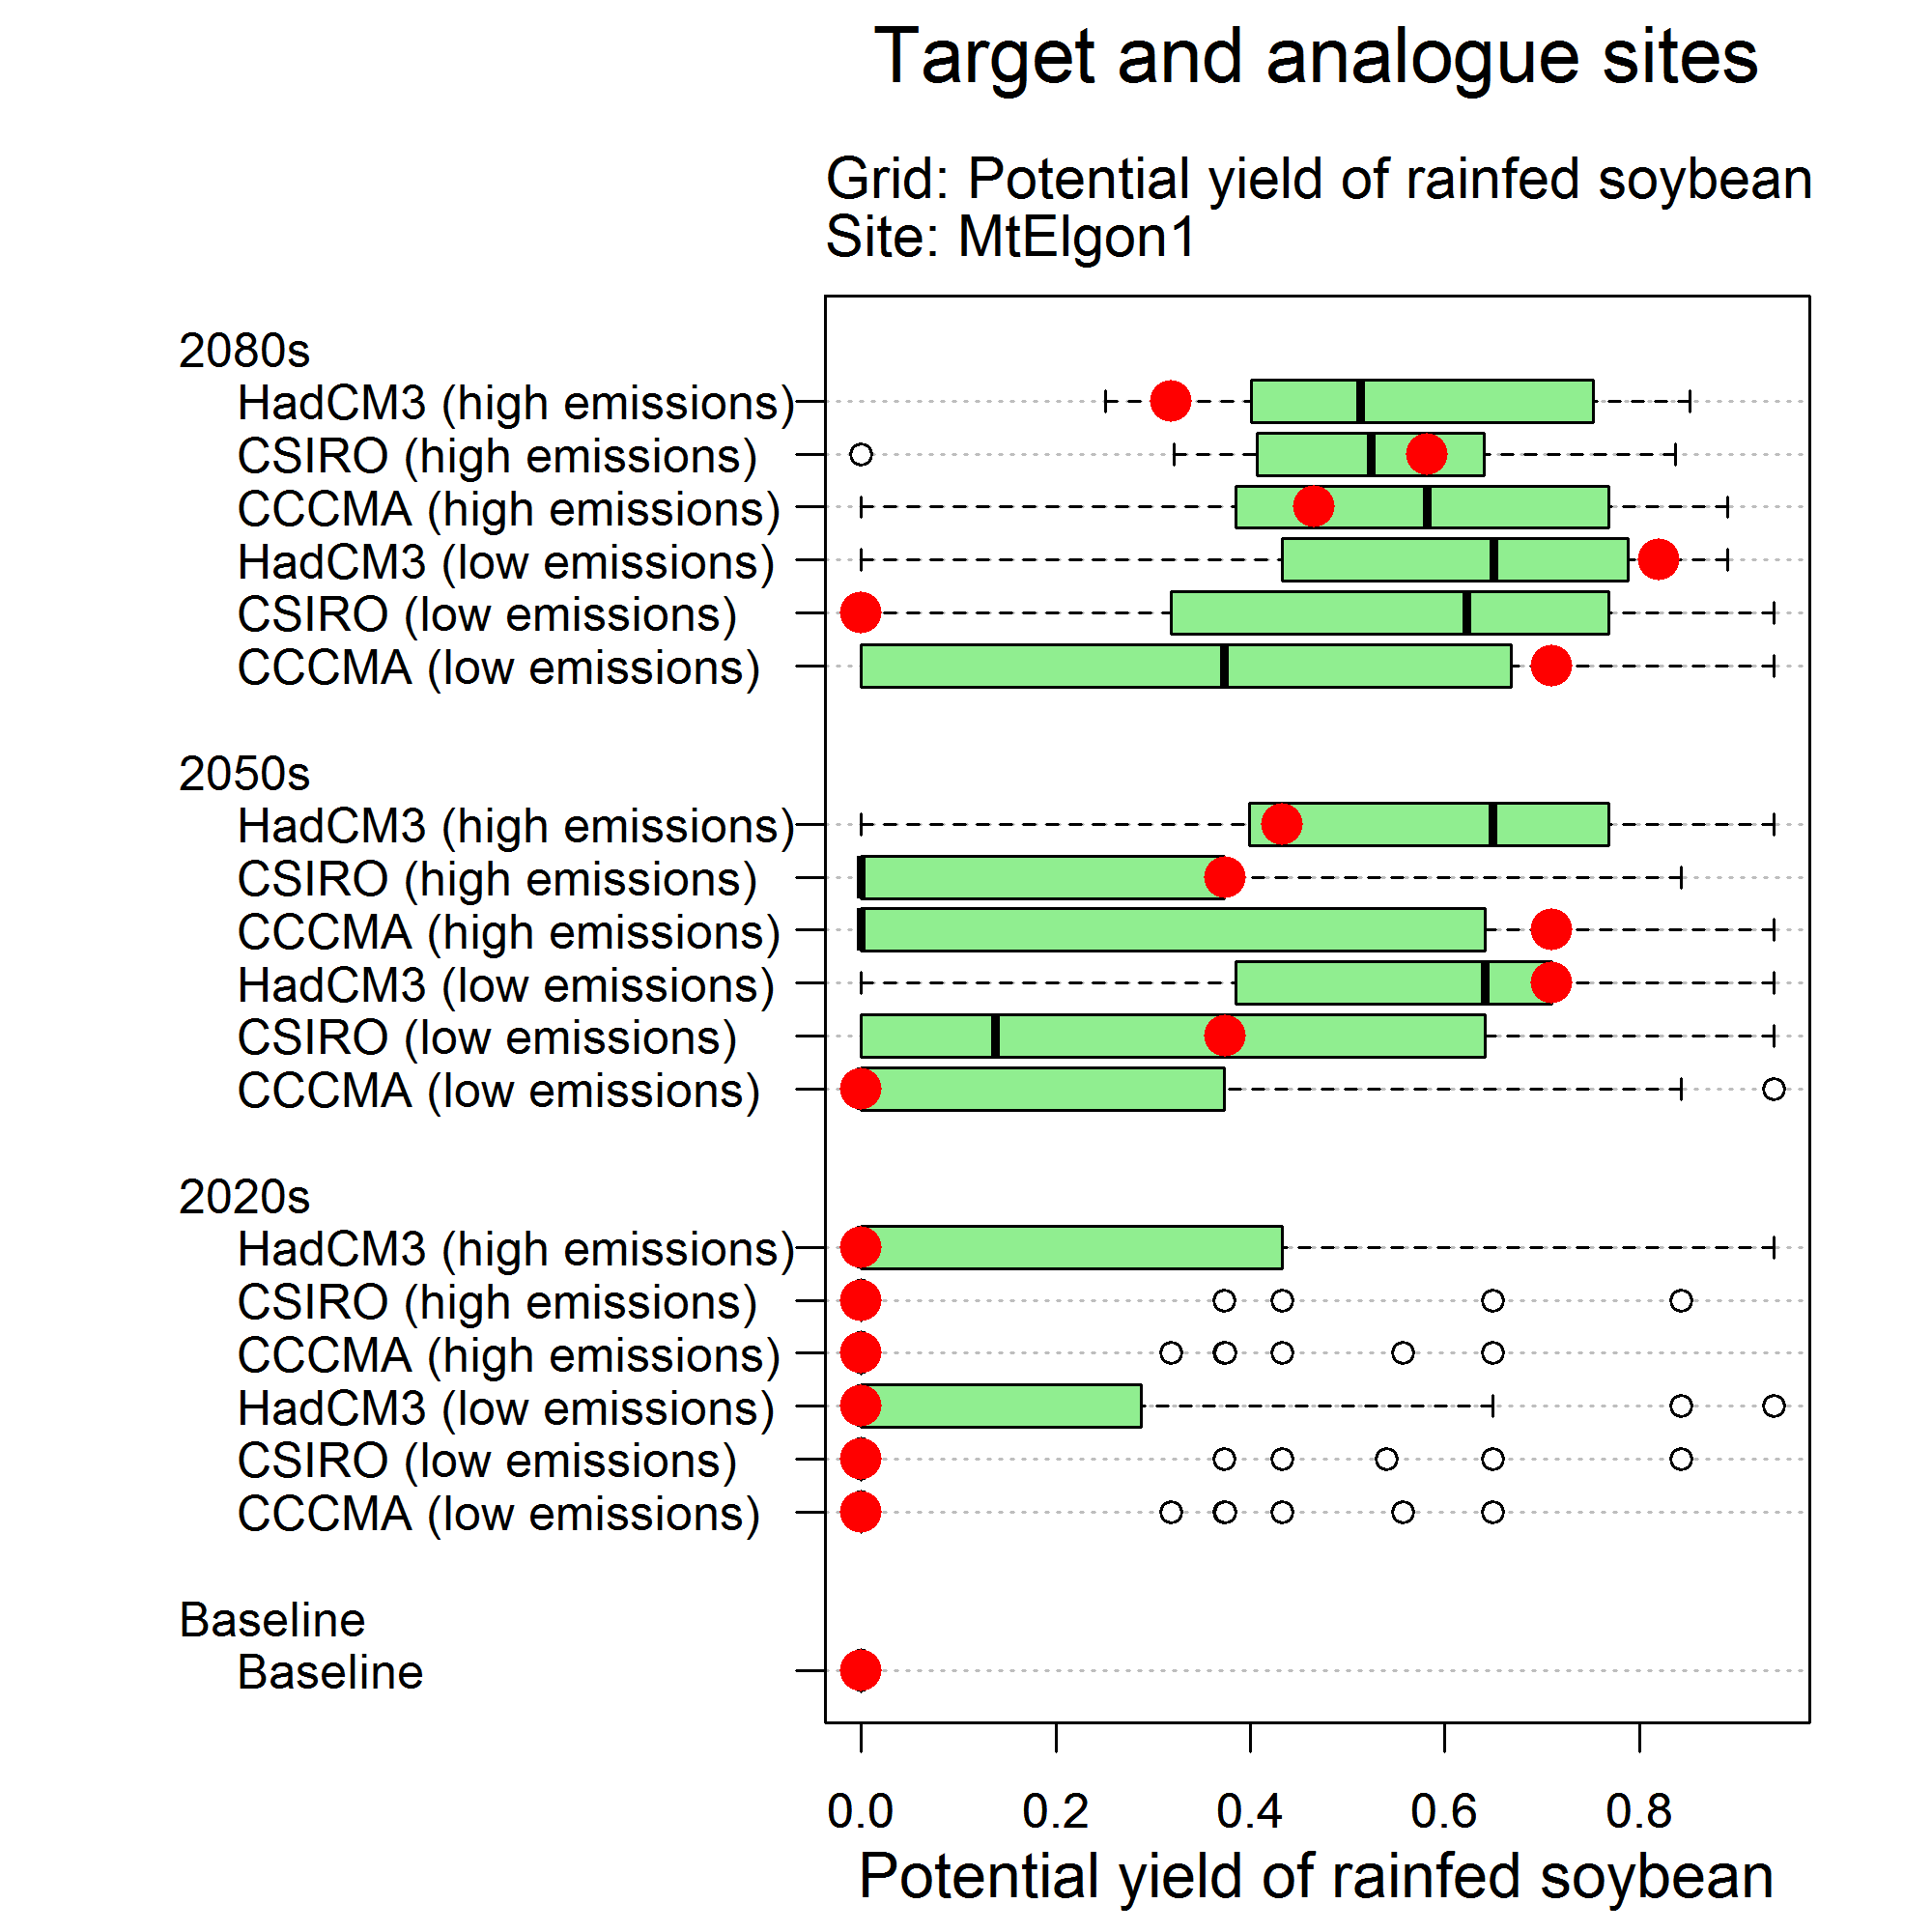
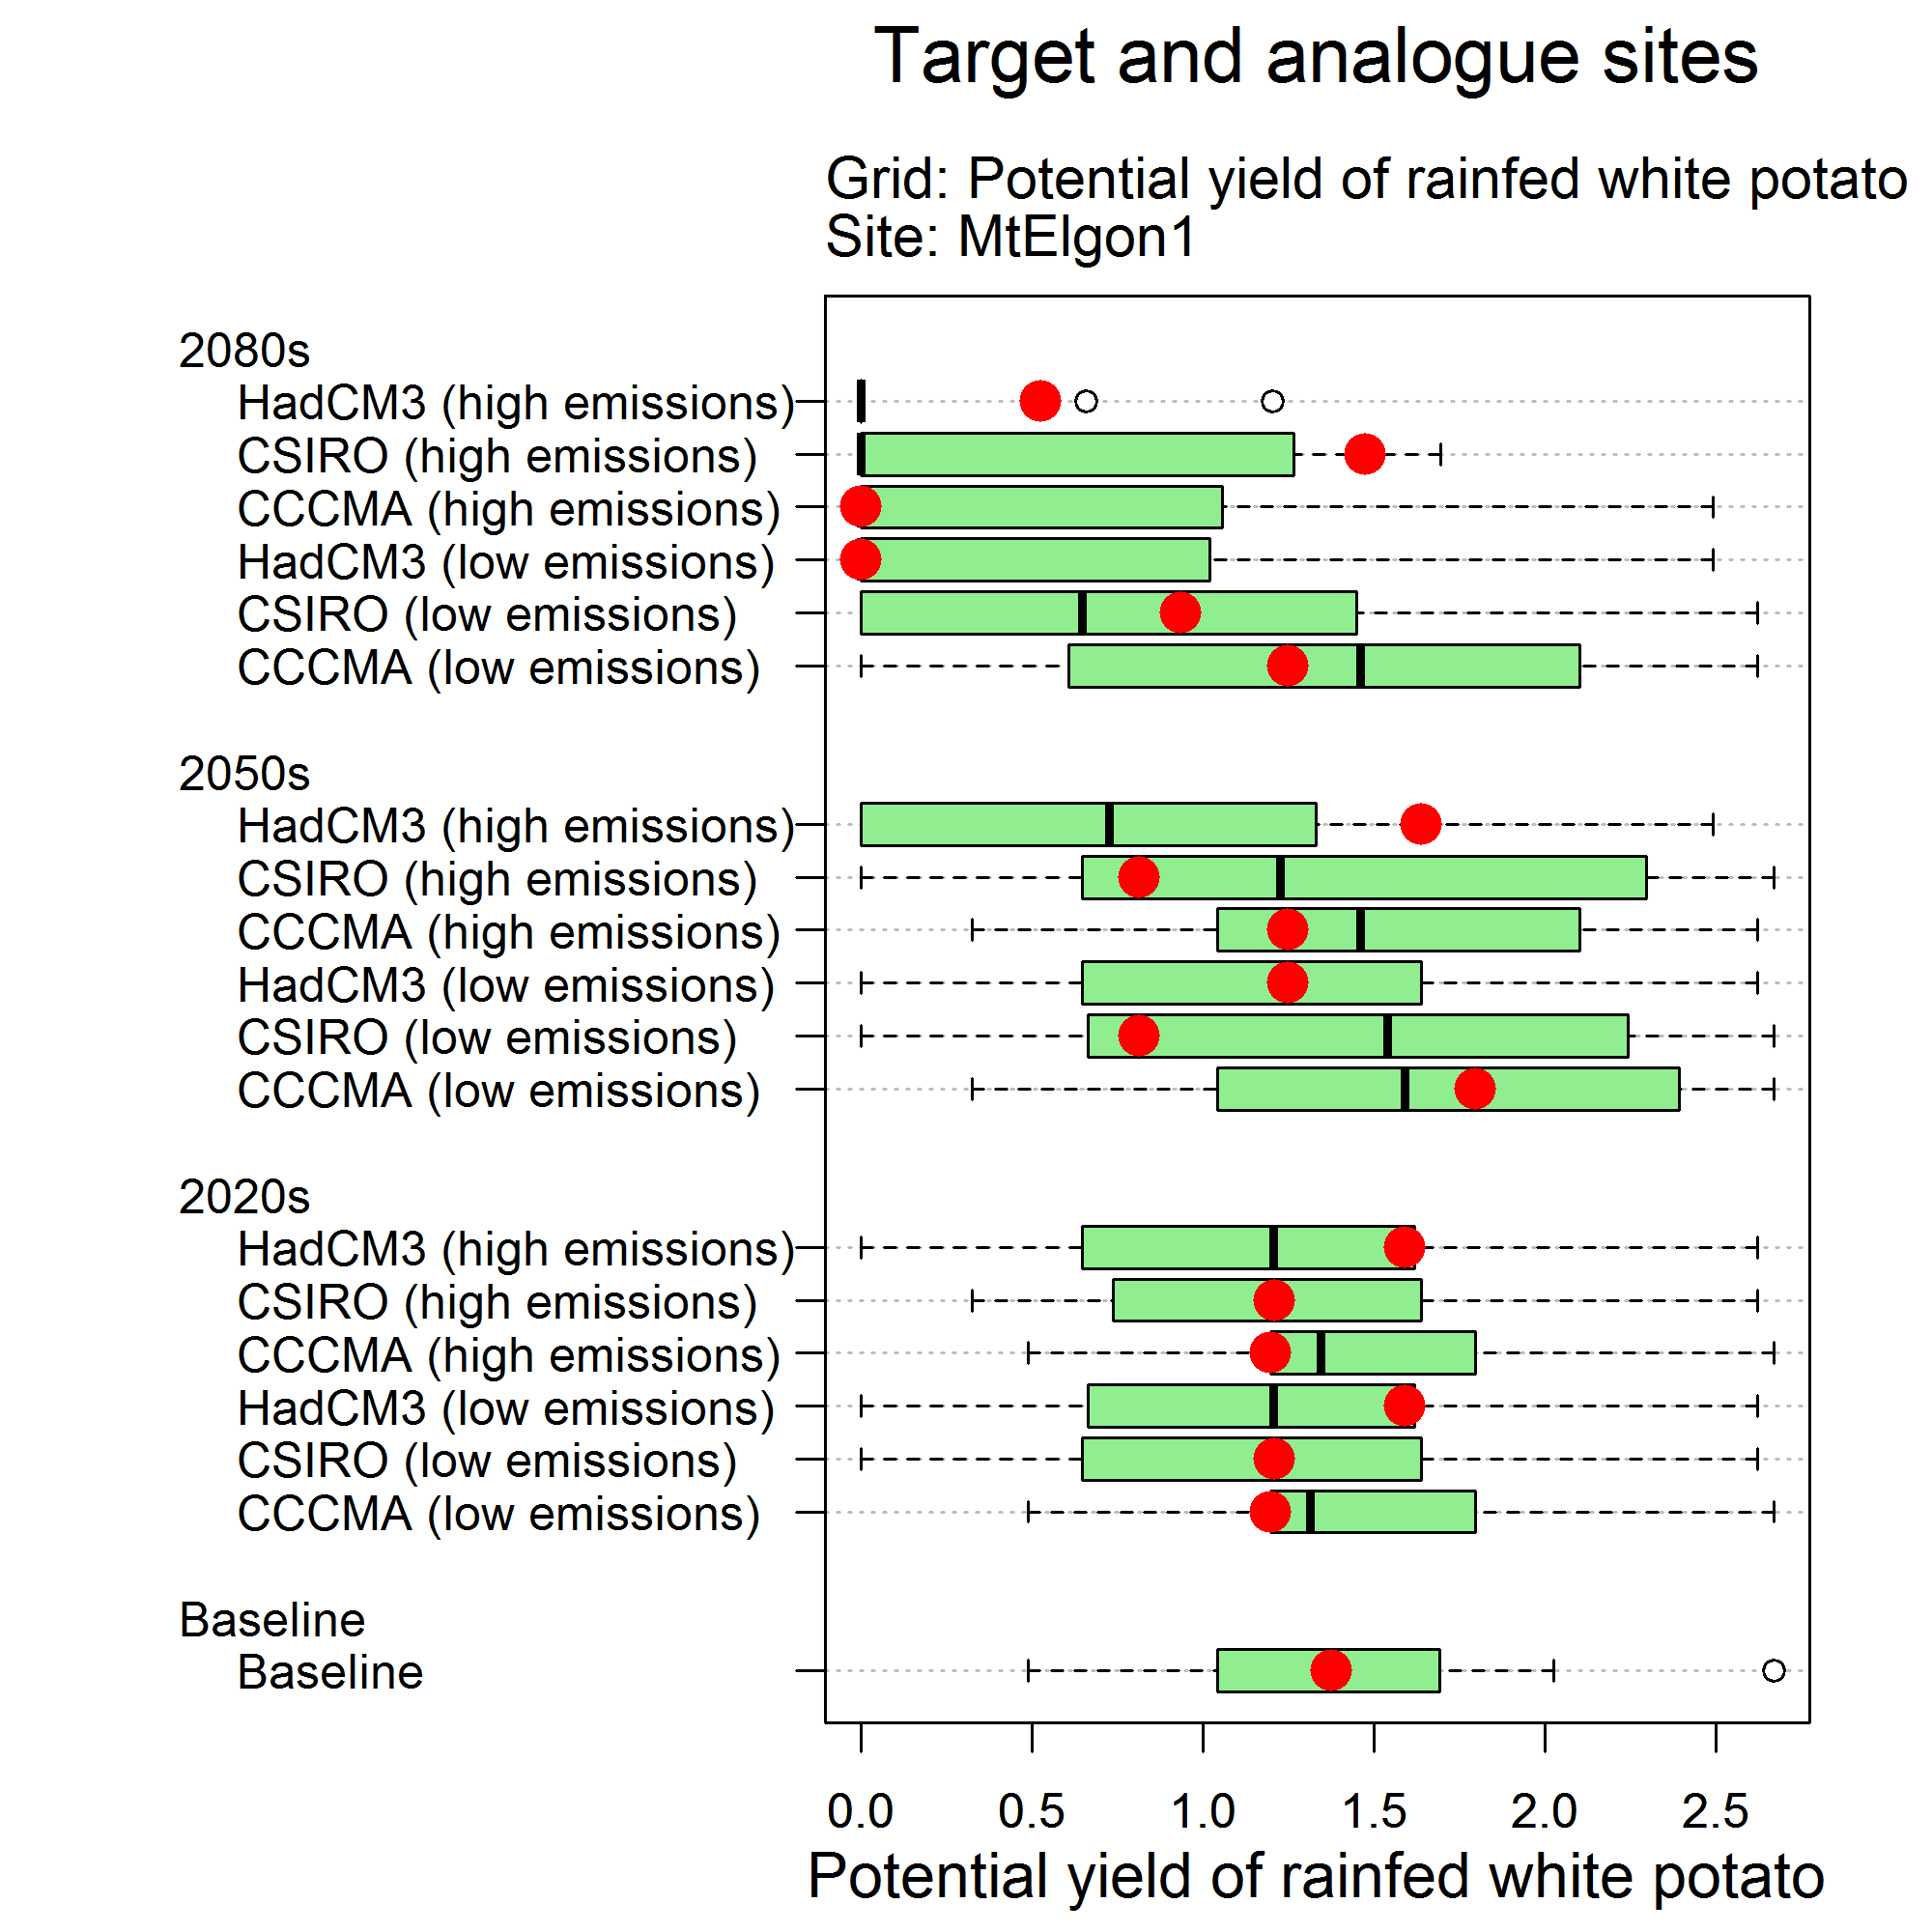
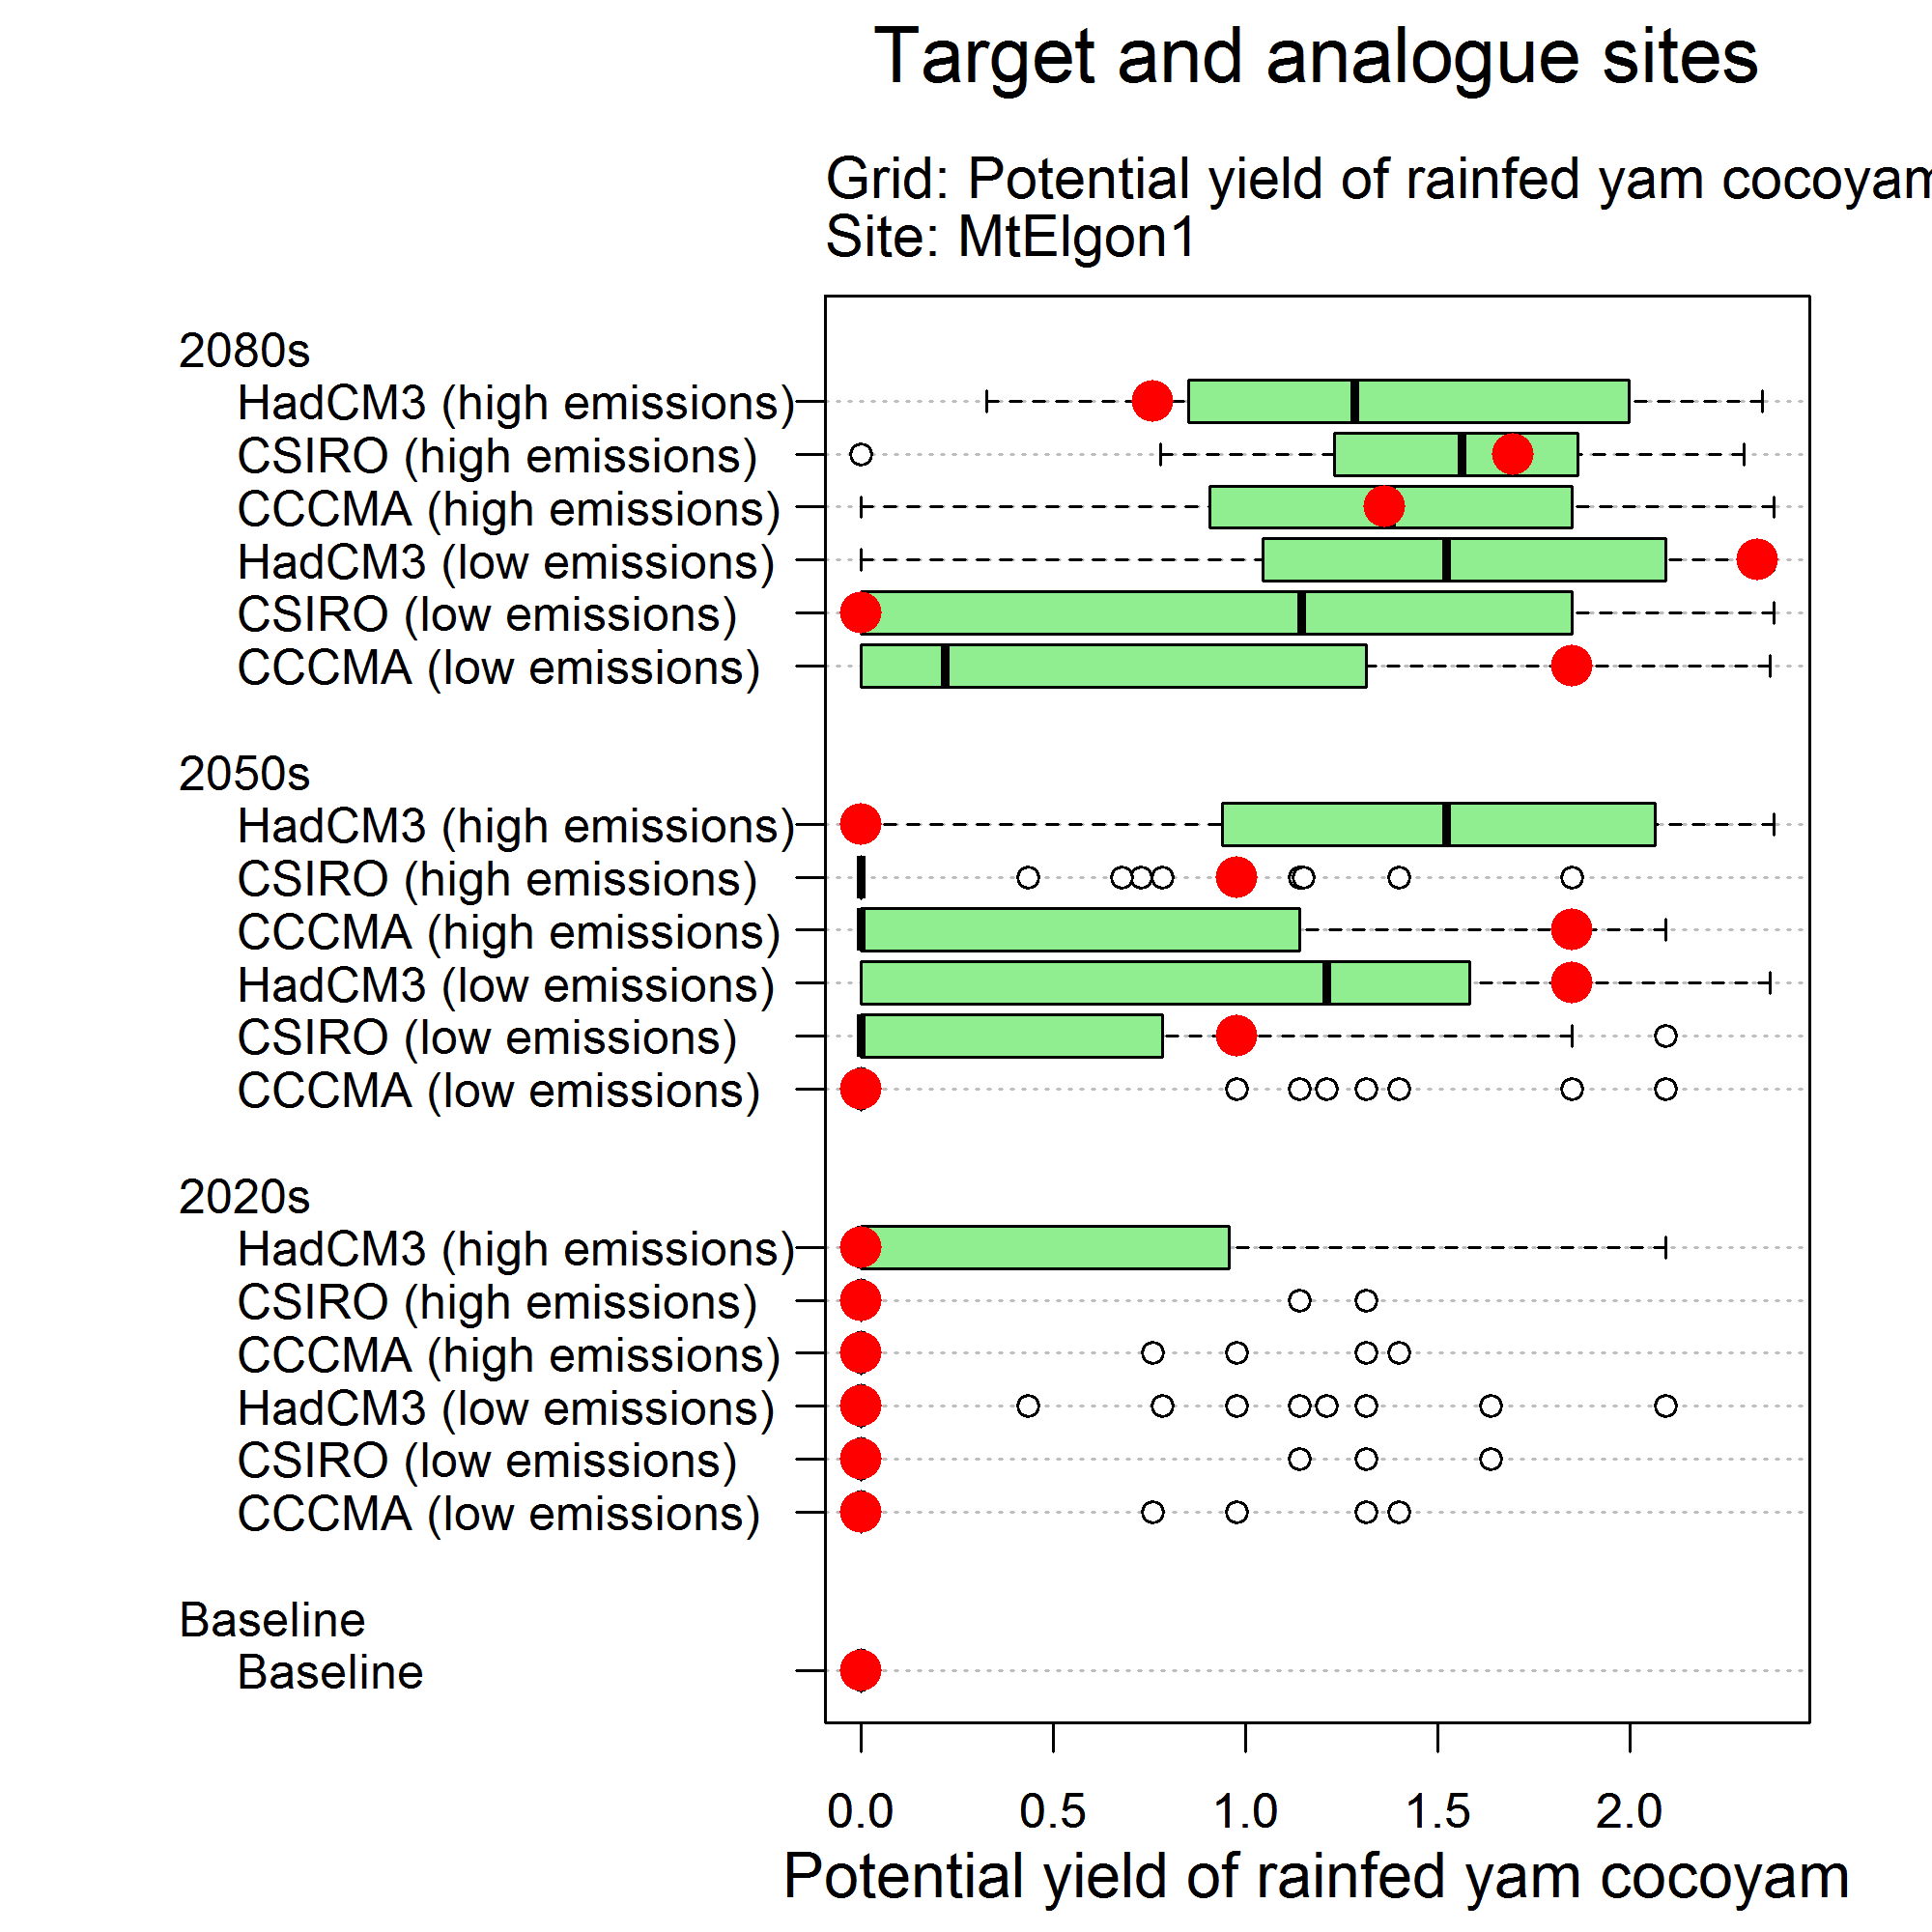
Context graphs (Base vs. analogue locations)
Vulnerability
Show vulnerability evaluation
Methodology
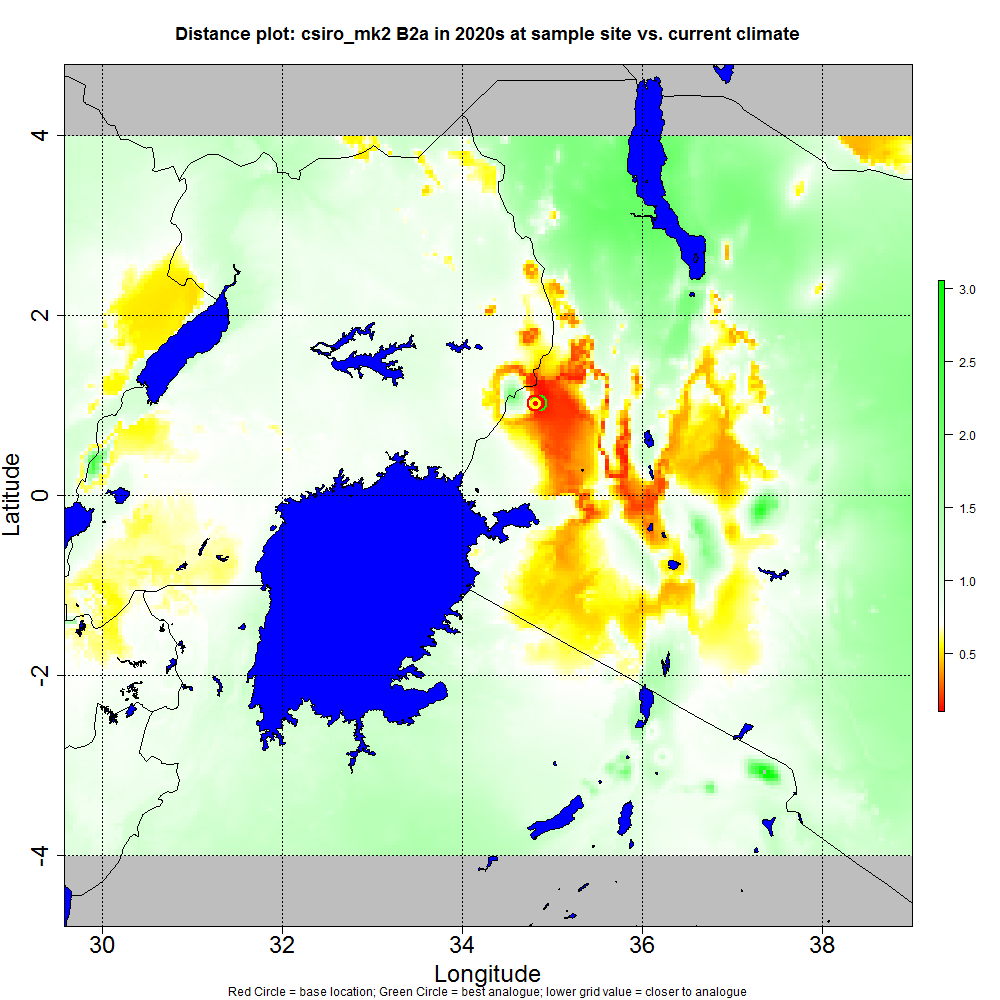
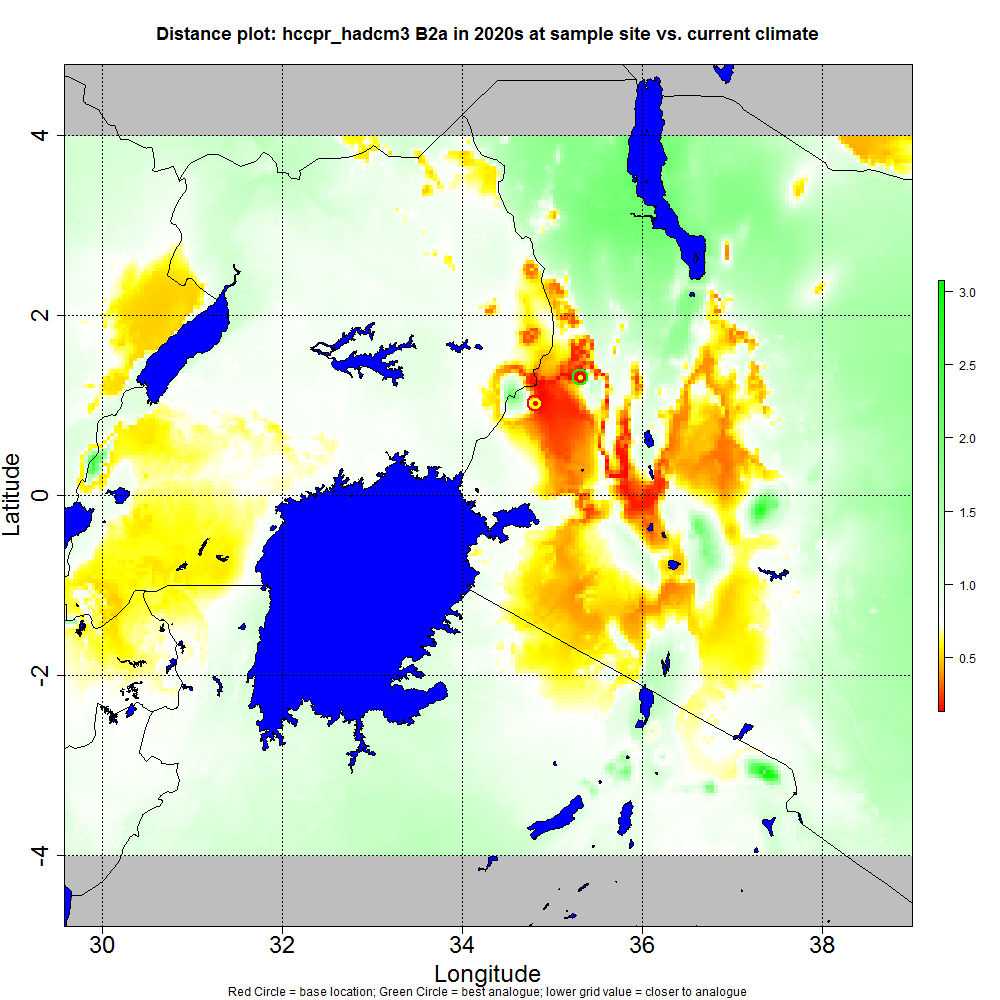
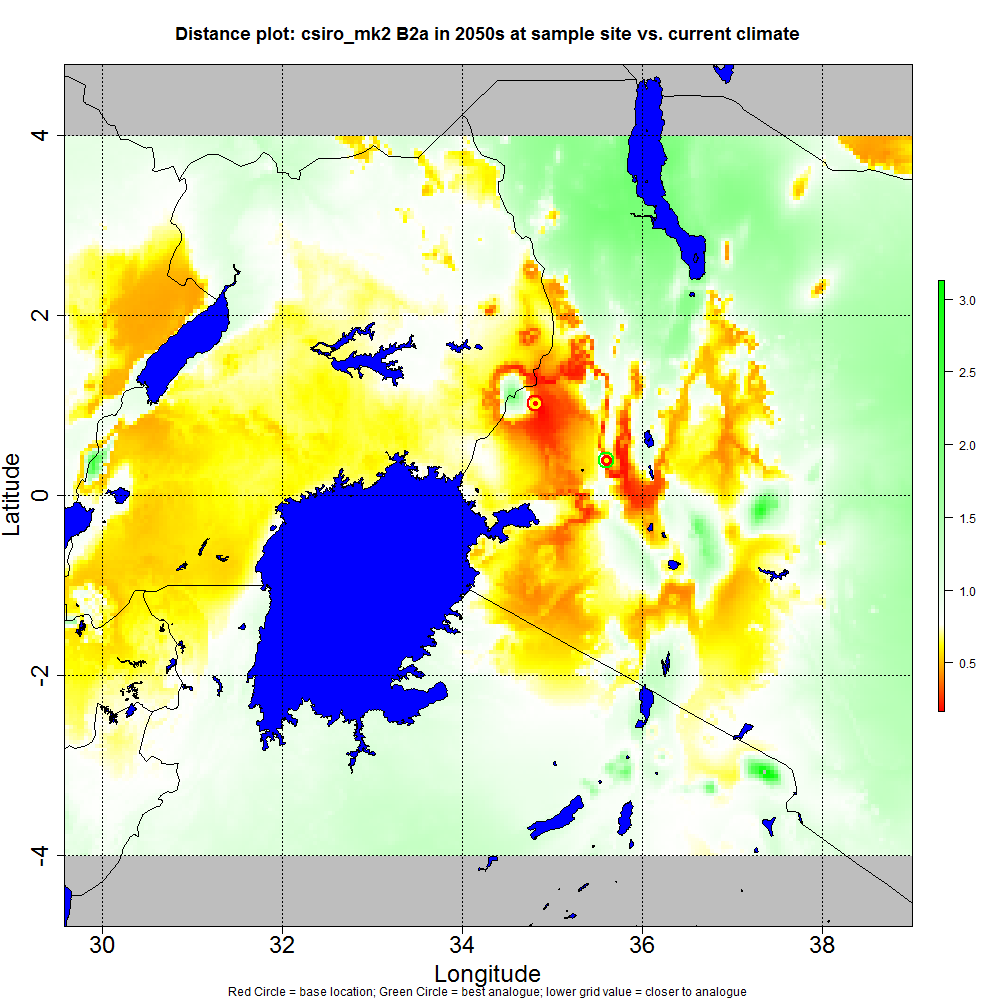
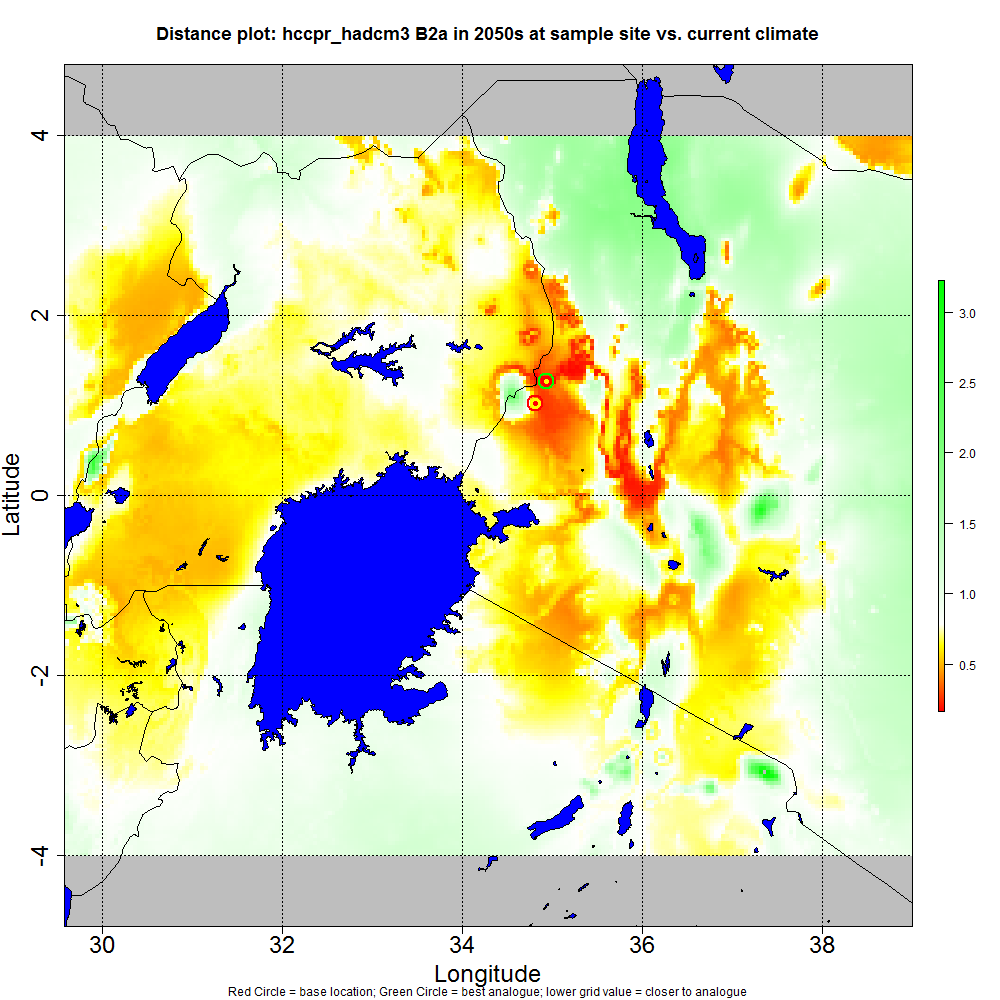
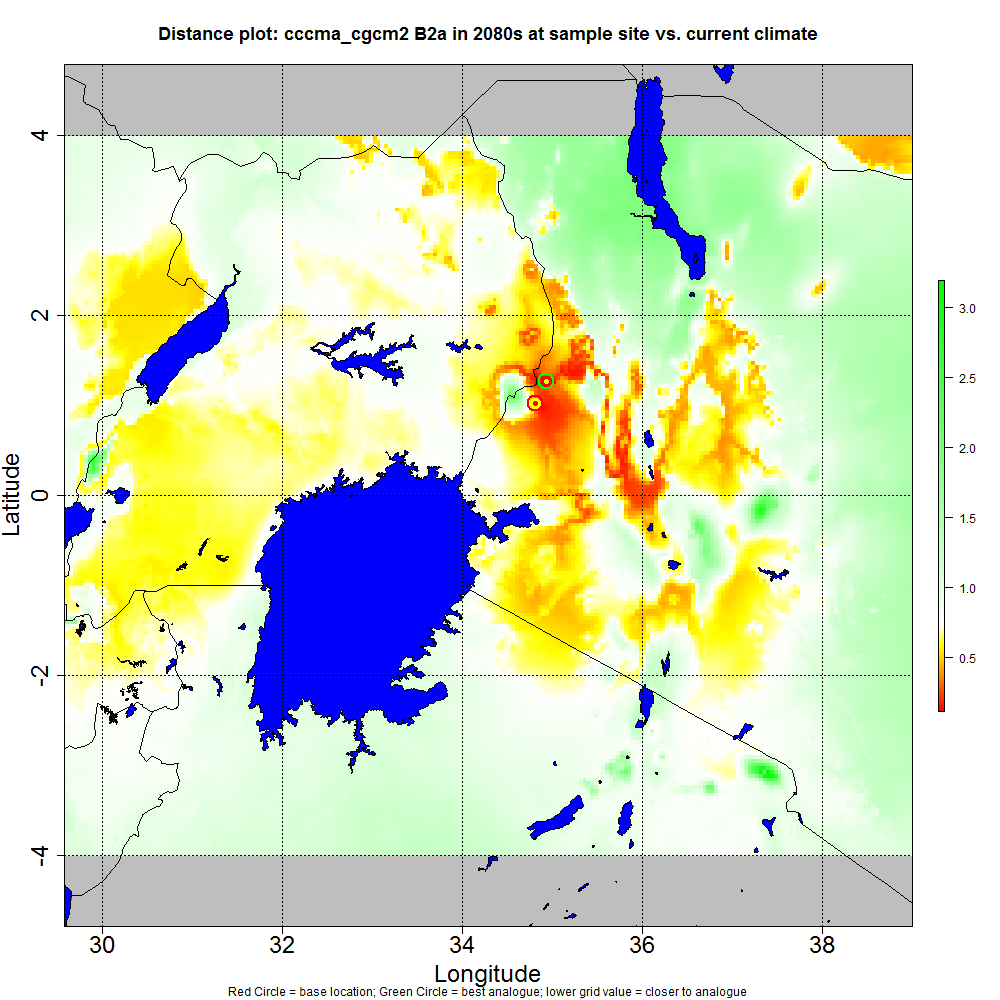
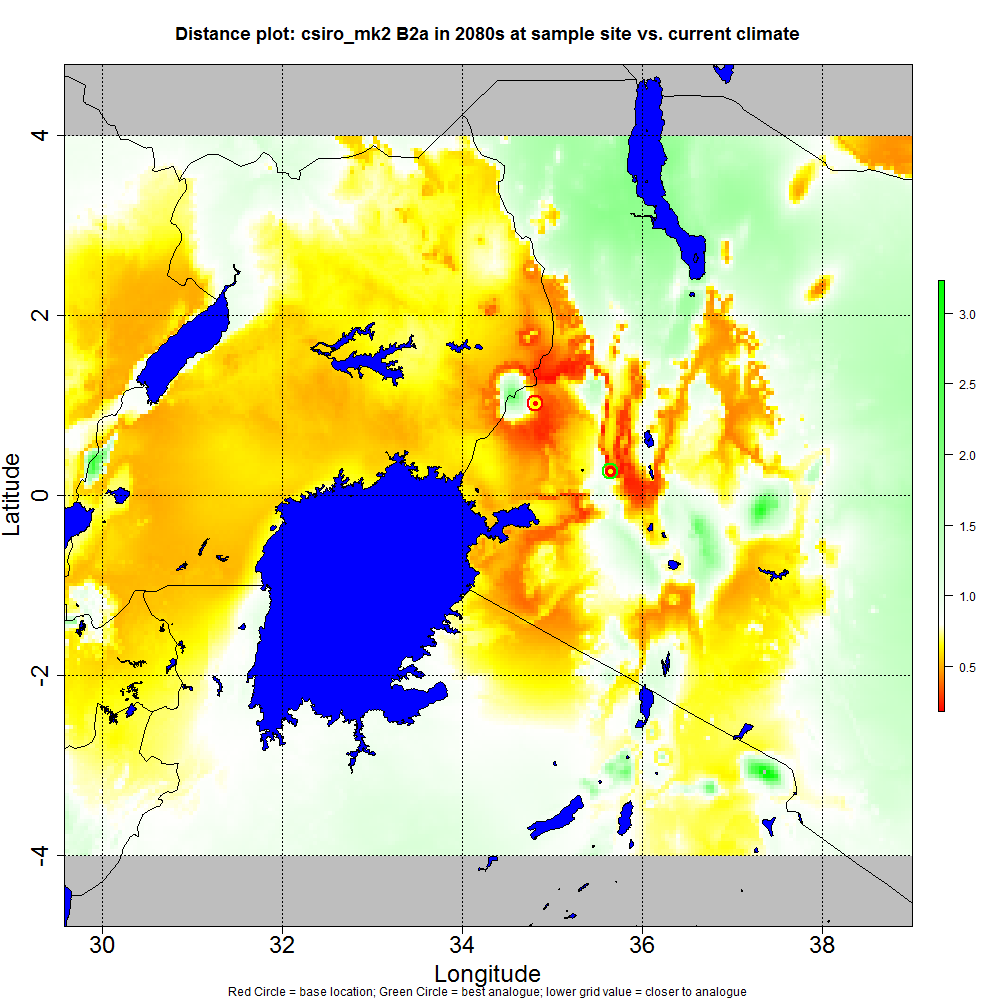
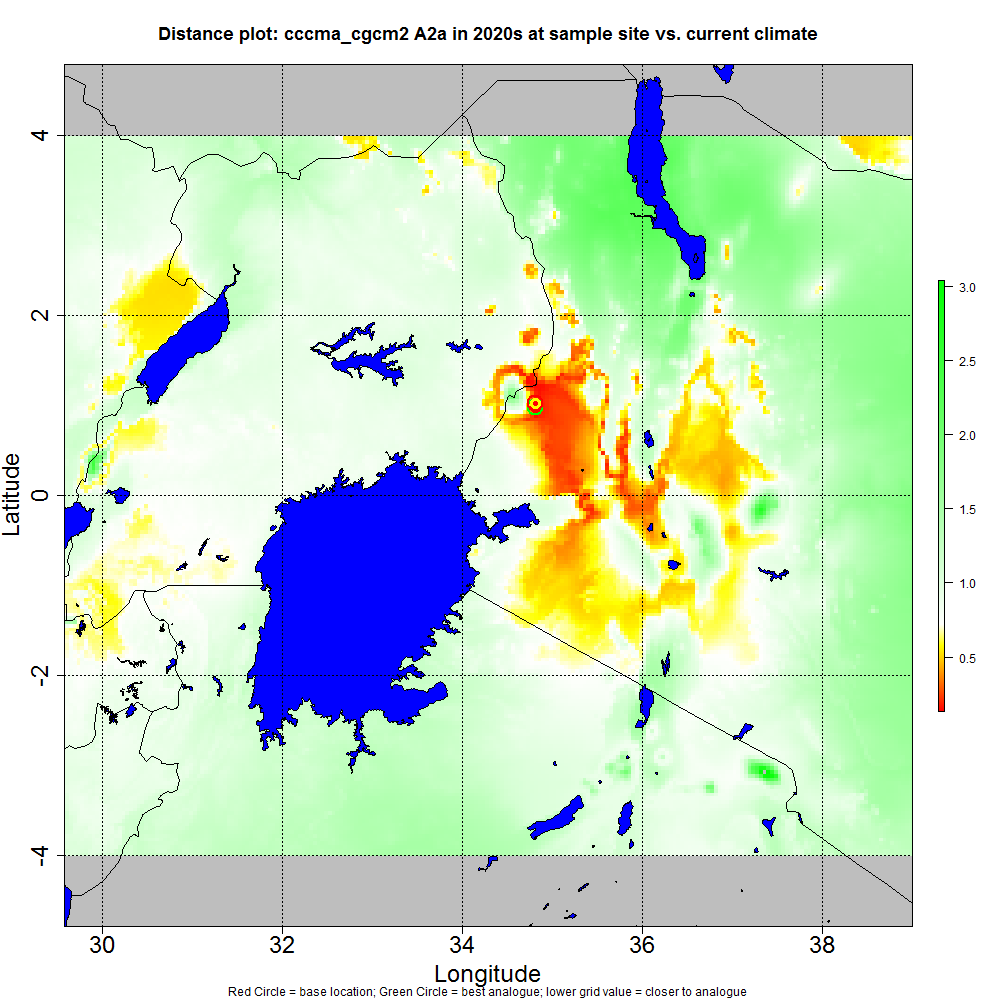
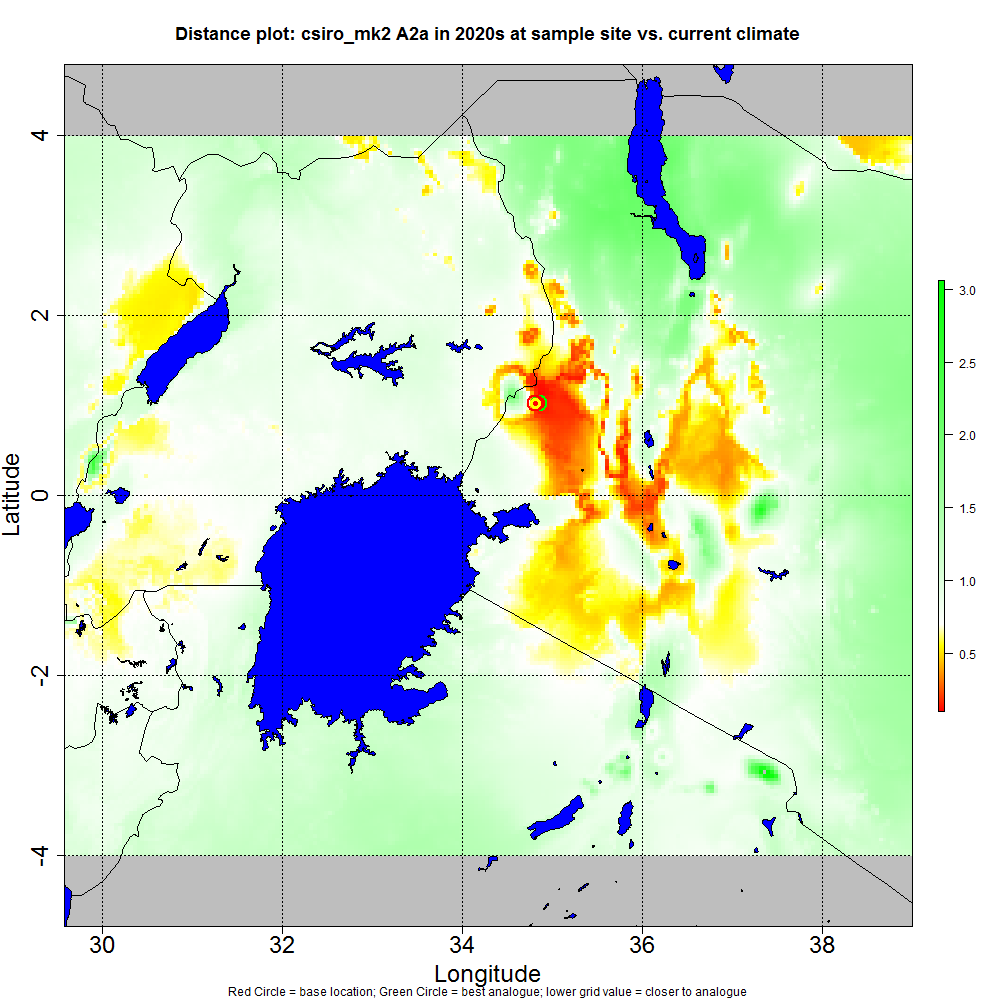
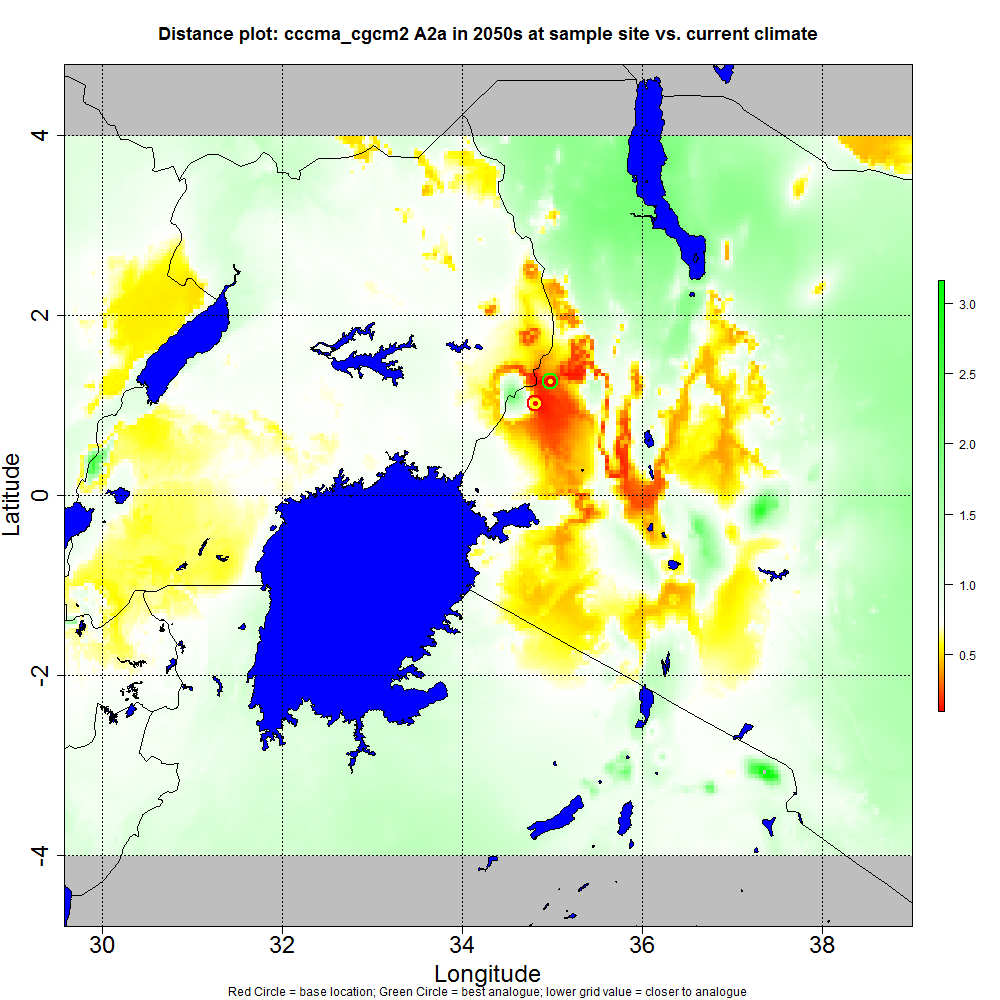
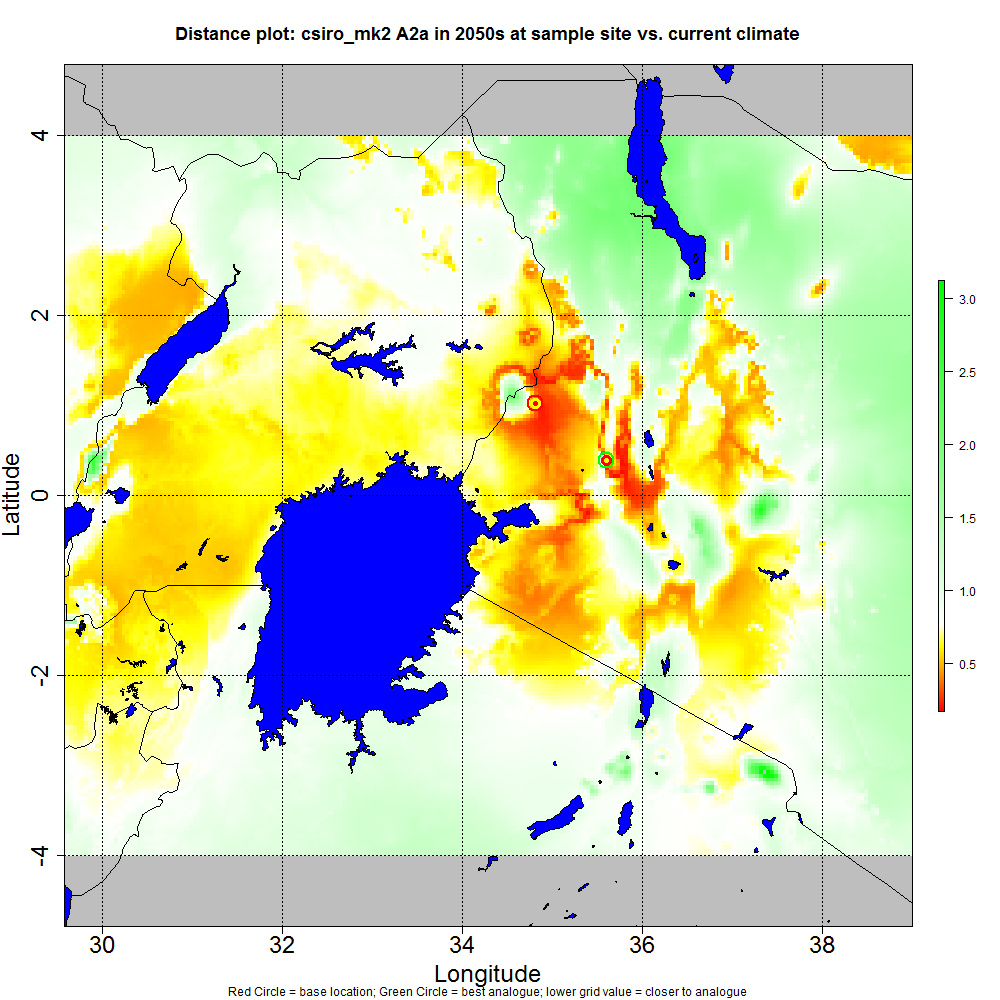
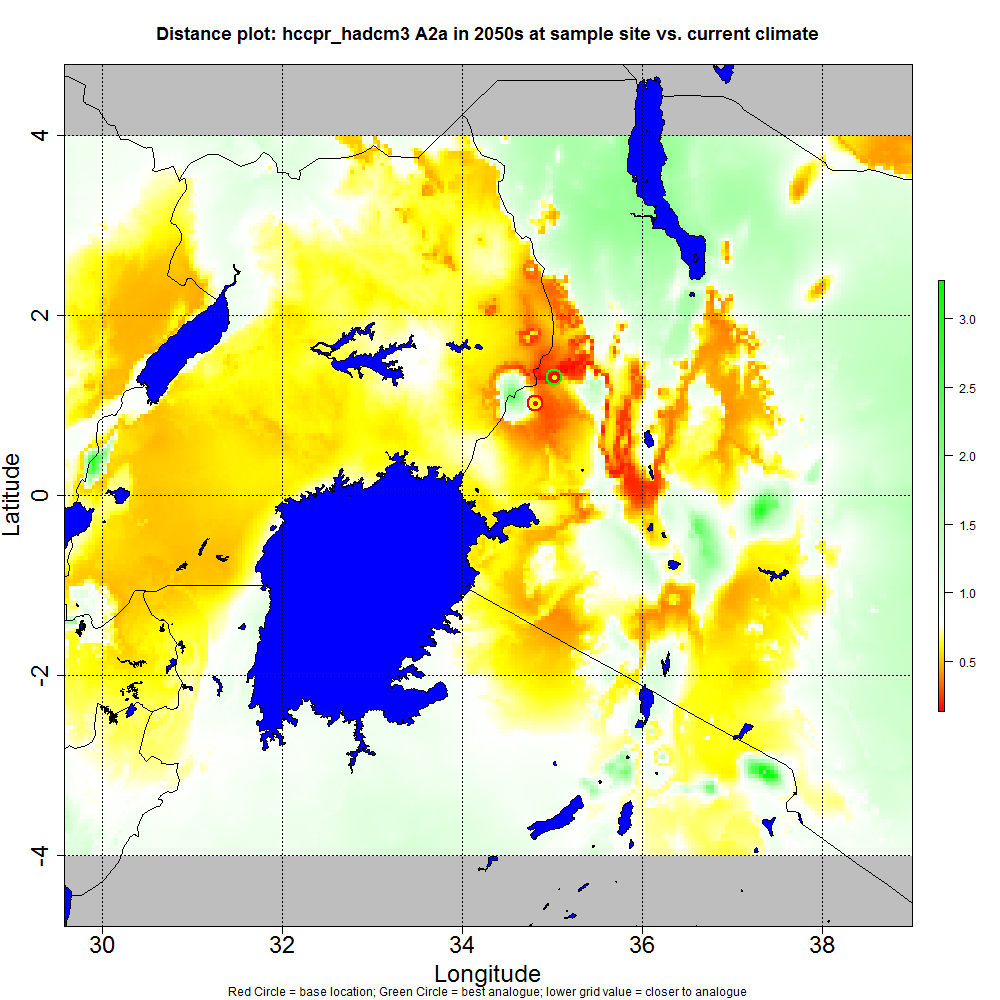
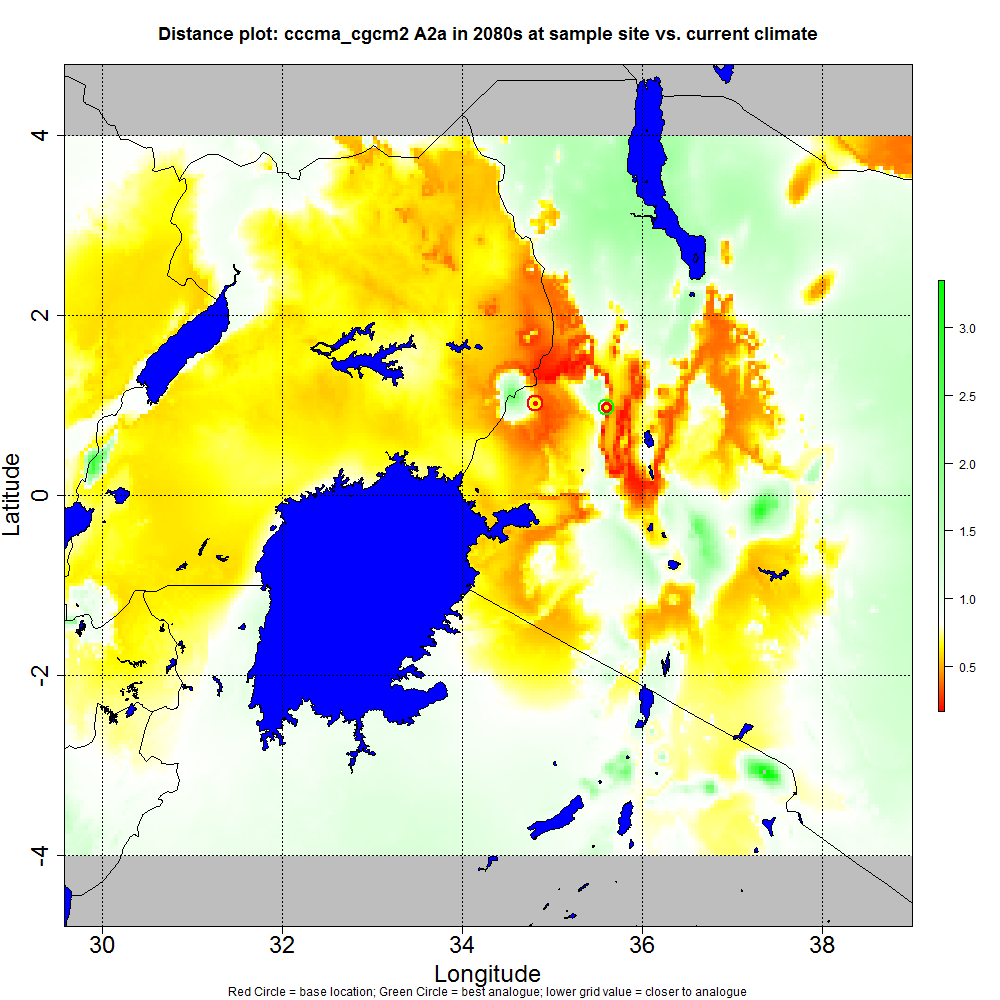
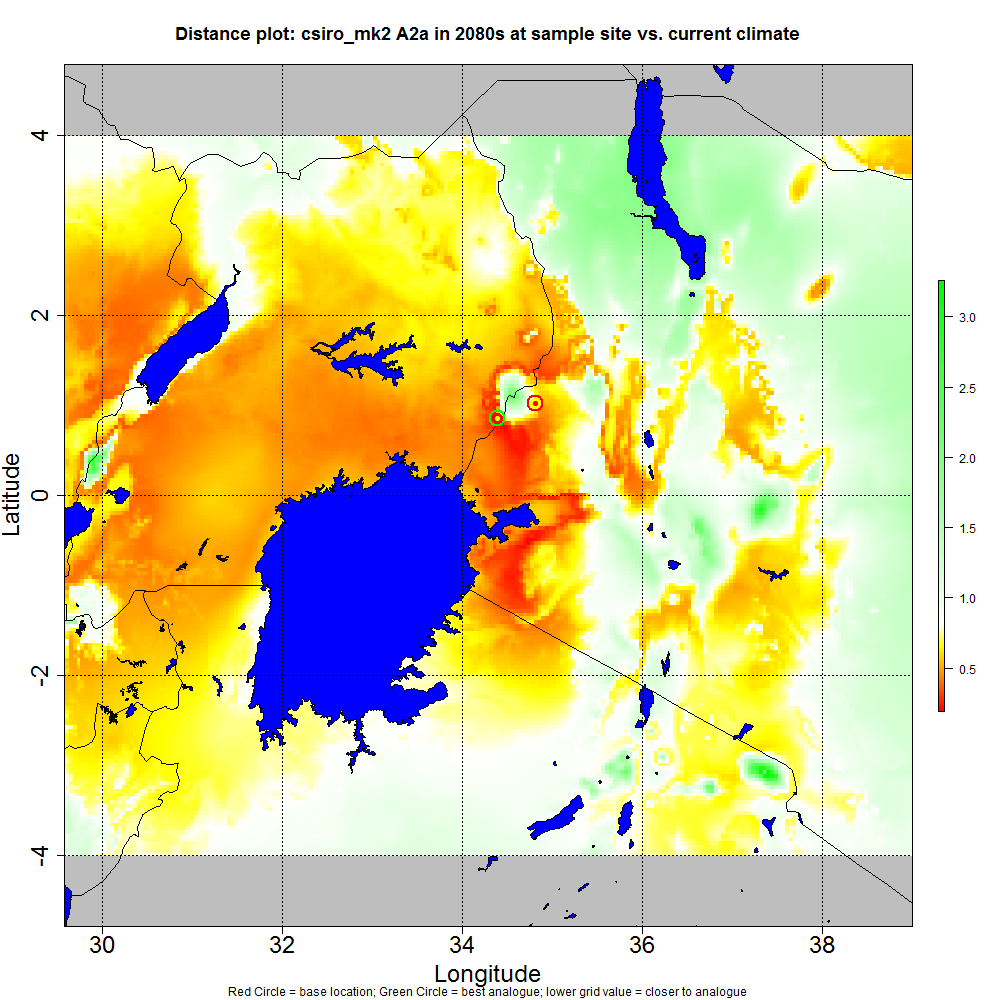
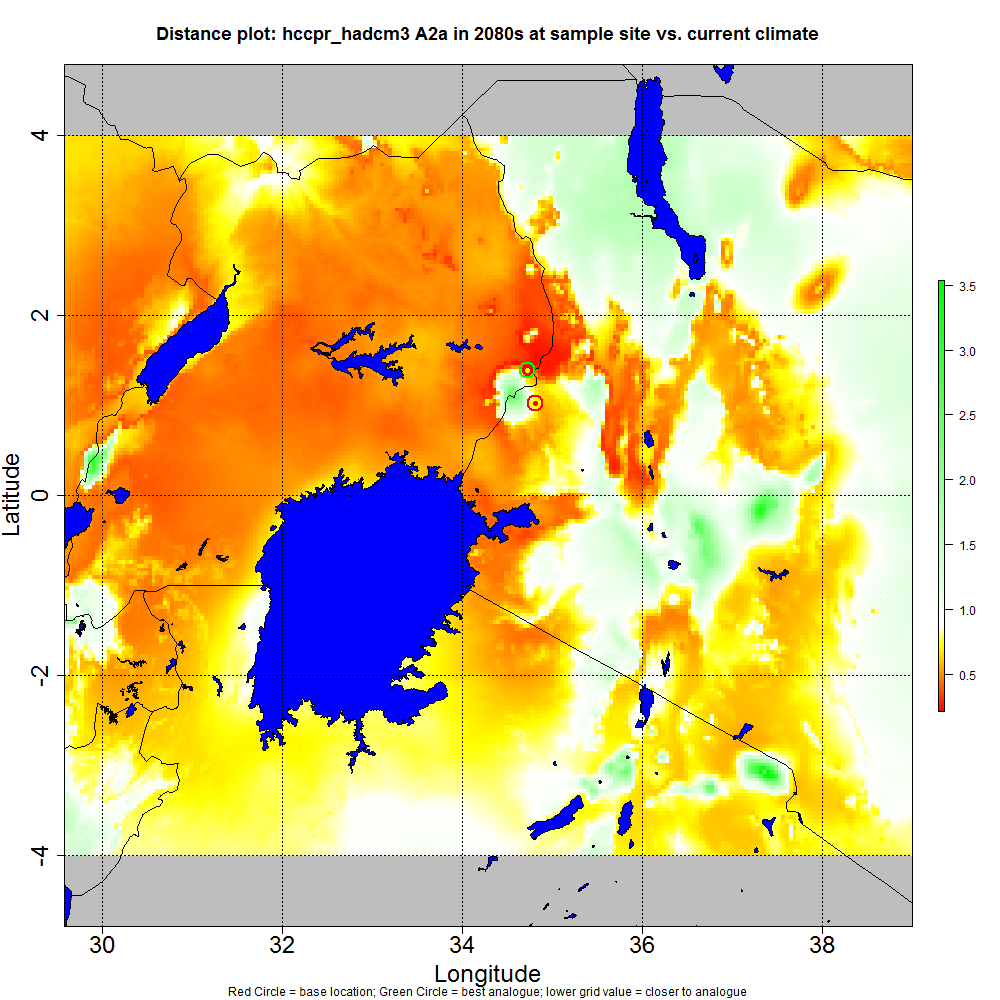
The search for analogues was based on the 'climate distance' method. This method finds the point on the target grid whose climate is most similar to the base grid at the sampled position. This means that for each grid cell of the target grids, and for each climate metric, the (absolute) difference between the base and target values is calculated. These values are then normalized by, in this case, the median of the population of distances over all cells of the target grids (there are other options). Distances of all included climate metrics are then weighted according to user specified weights (see table below) and added up, resulting in one distance value. The grid cell with the minimum distance value is then identified as the analogue location.
Weight list | Climate metric | Short name | Jan | Feb | Mar | Apr | May | Jun | Jul | Aug | Sep | Oct | Nov | Dec |
|---|
| Mean monthly Precipitation | P_m_me | 2 | 2 | 2 | 2 | 2 | 2 | 2 | 2 | 2 | 2 | 2 | 2 |
| Mean monthly Maximum temperature | MX_m_me | 1 | 1 | 1 | 1 | 1 | 1 | 1 | 1 | 1 | 1 | 1 | 1 |
| Mean monthly Minimum temperature | MI_m_me | 1 | 1 | 1 | 1 | 1 | 1 | 1 | 1 | 1 | 1 | 1 | 1 |